

By Michael Bitzer
North Carolina’s 2026 midterm elections will put all 170 seats in the General Assembly on the ballot, but not all districts will be equally competitive. The key question is, in this political environment, where Republican electoral advantages may be most vulnerable—and how much that picture changes depending on which statewide election results are used to measure a district’s partisan lean.
Using four different electoral measurements, this analysis examines both chambers of the North Carolina General Assembly, providing a transparent, data-based way to assess where partisan advantages appear most vulnerable in both chambers and what to watch as election results arrive on November 3rd.
The results point to a relatively small group of Republican-held districts that could provide early clues about the direction of the midterm elections, particularly if the electorate shifts toward Democrats. Four N.C. House districts and four N.C. Senate districts stand out as especially important places to watch, although the evidence for competitiveness varies by district and by measurement.
As a reminder, here are the four measurement categories that was used for the U.S. House district analysis:
Each measurement offers a different way to assess the underlying partisan lean of a legislative district. A Trump-only measure provides one baseline, while the additional measures incorporate other statewide contests, including the gubernatorial and Council of State races. Comparing these results helps distinguish districts with consistently strong partisan advantages from those where the apparent advantage weakens when a broader range of electoral contests is considered.
And for the classification of the districts using the above measurements, the general ranges are:
Competitive but lean to one party: 50-55%
Likely one party: 56-59%
Solid/Strong one party: 60% or greater
With this classification scheme, here are the 120 N.C. State House of Representatives districts and their respective categories, using the Trump-only and the All Contests measurements:
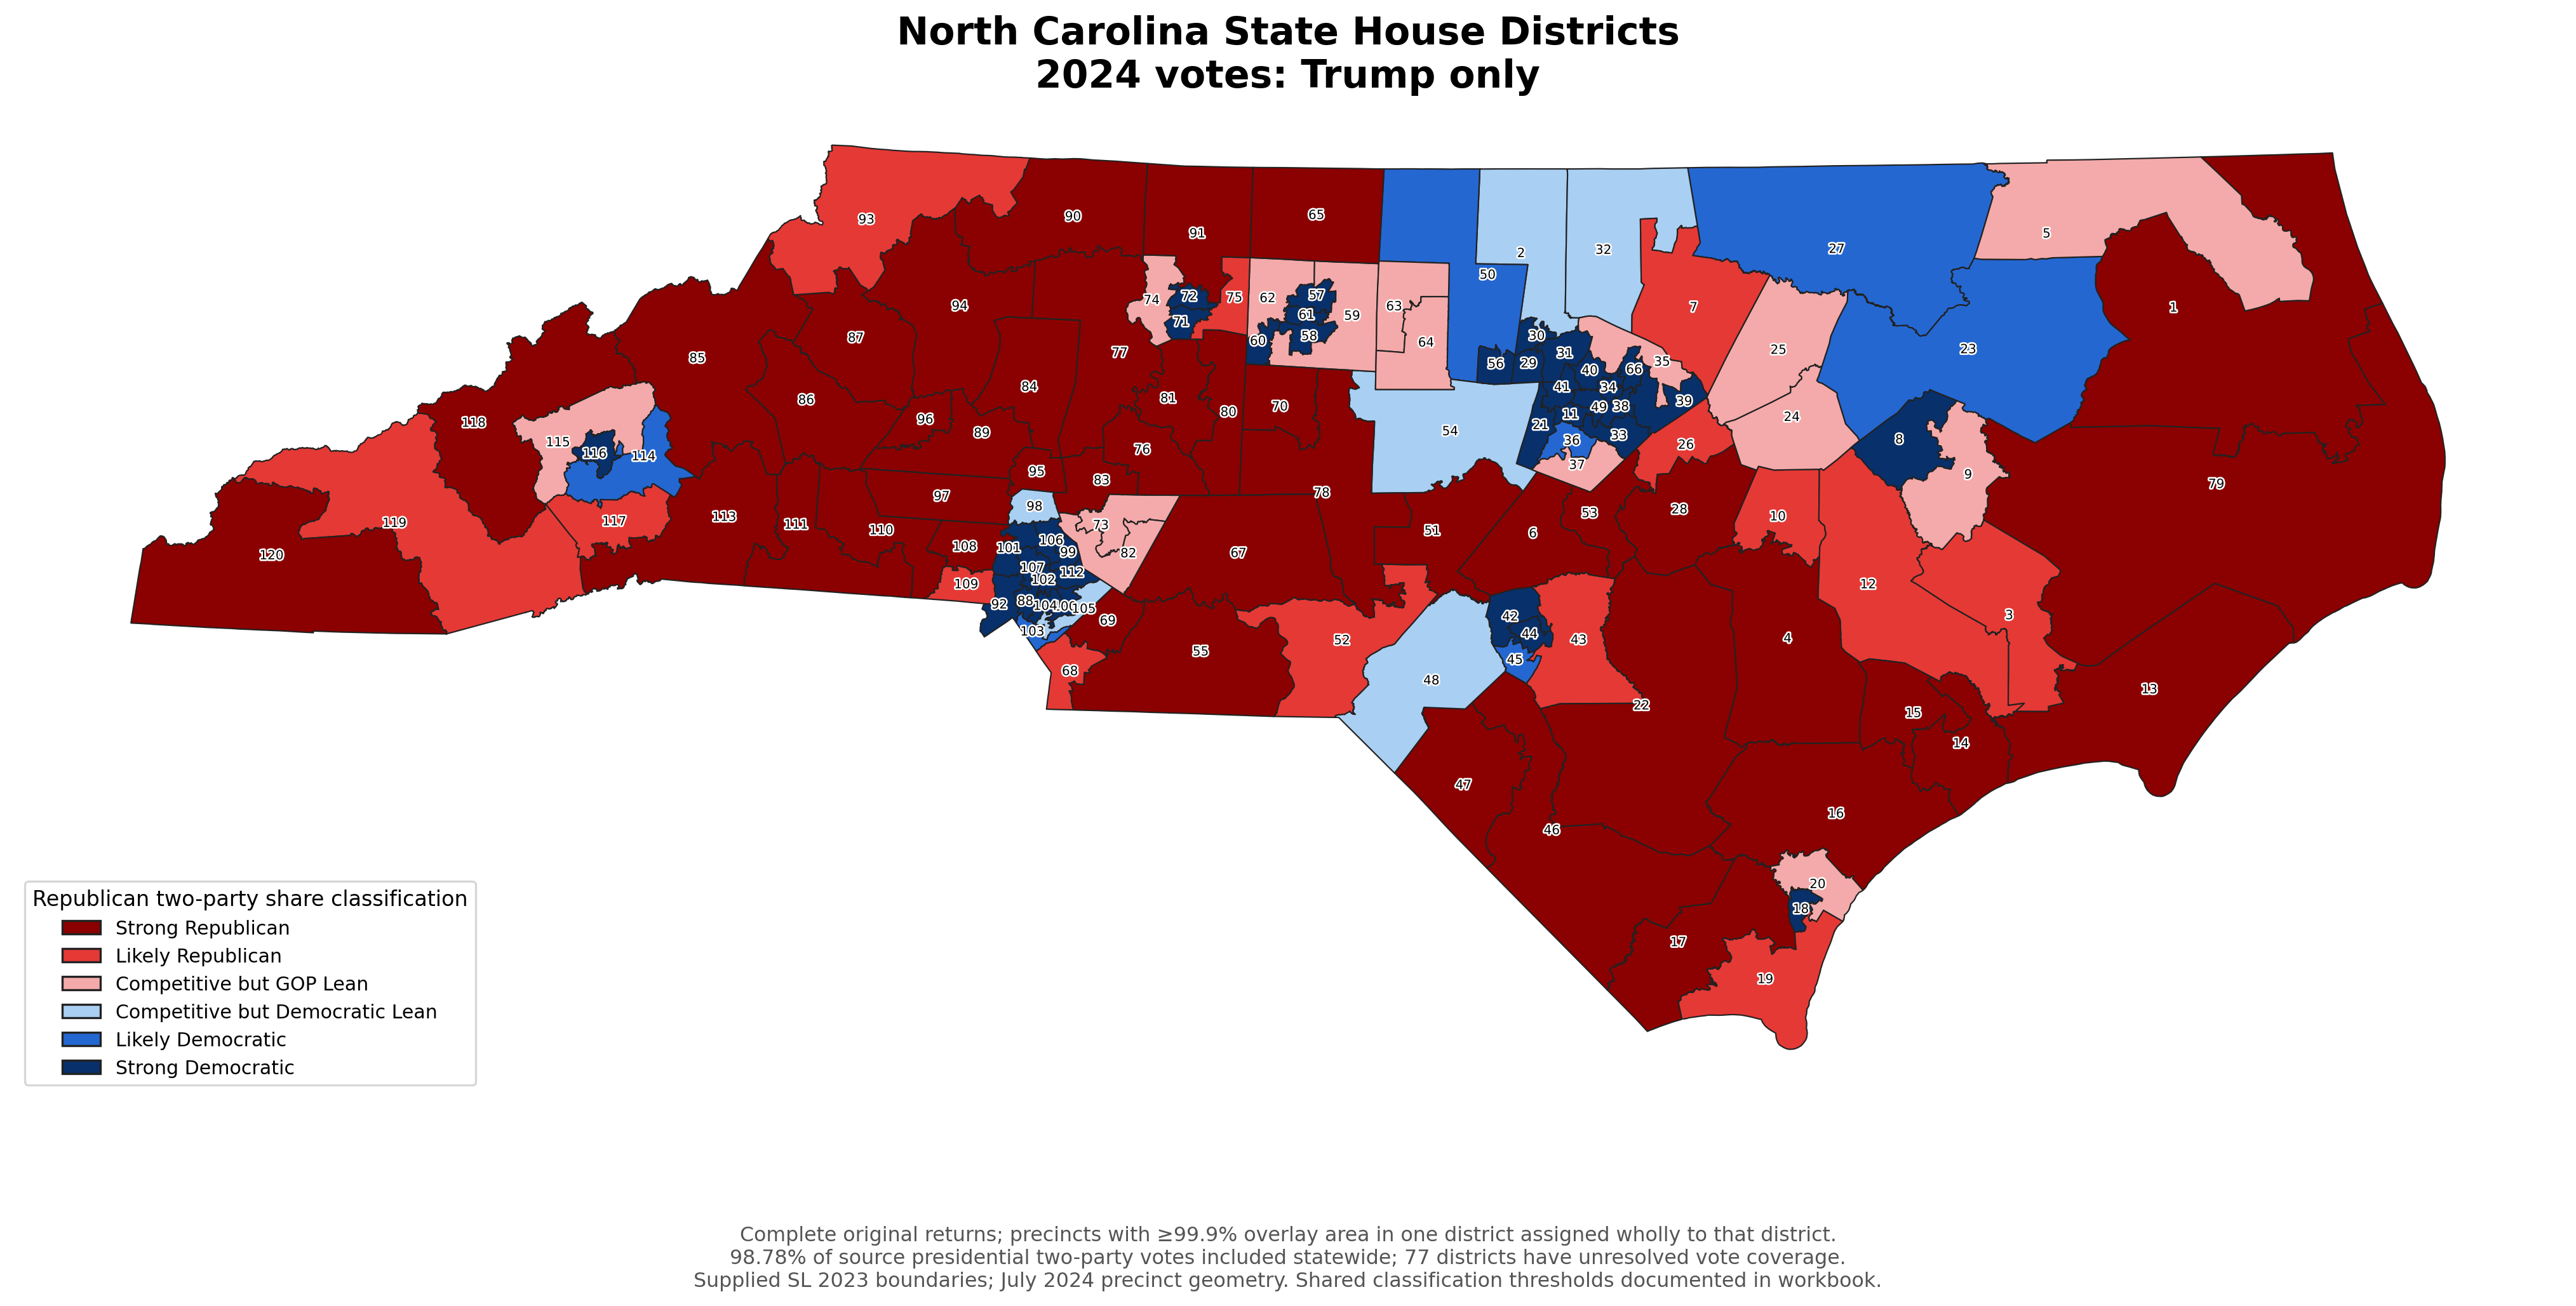
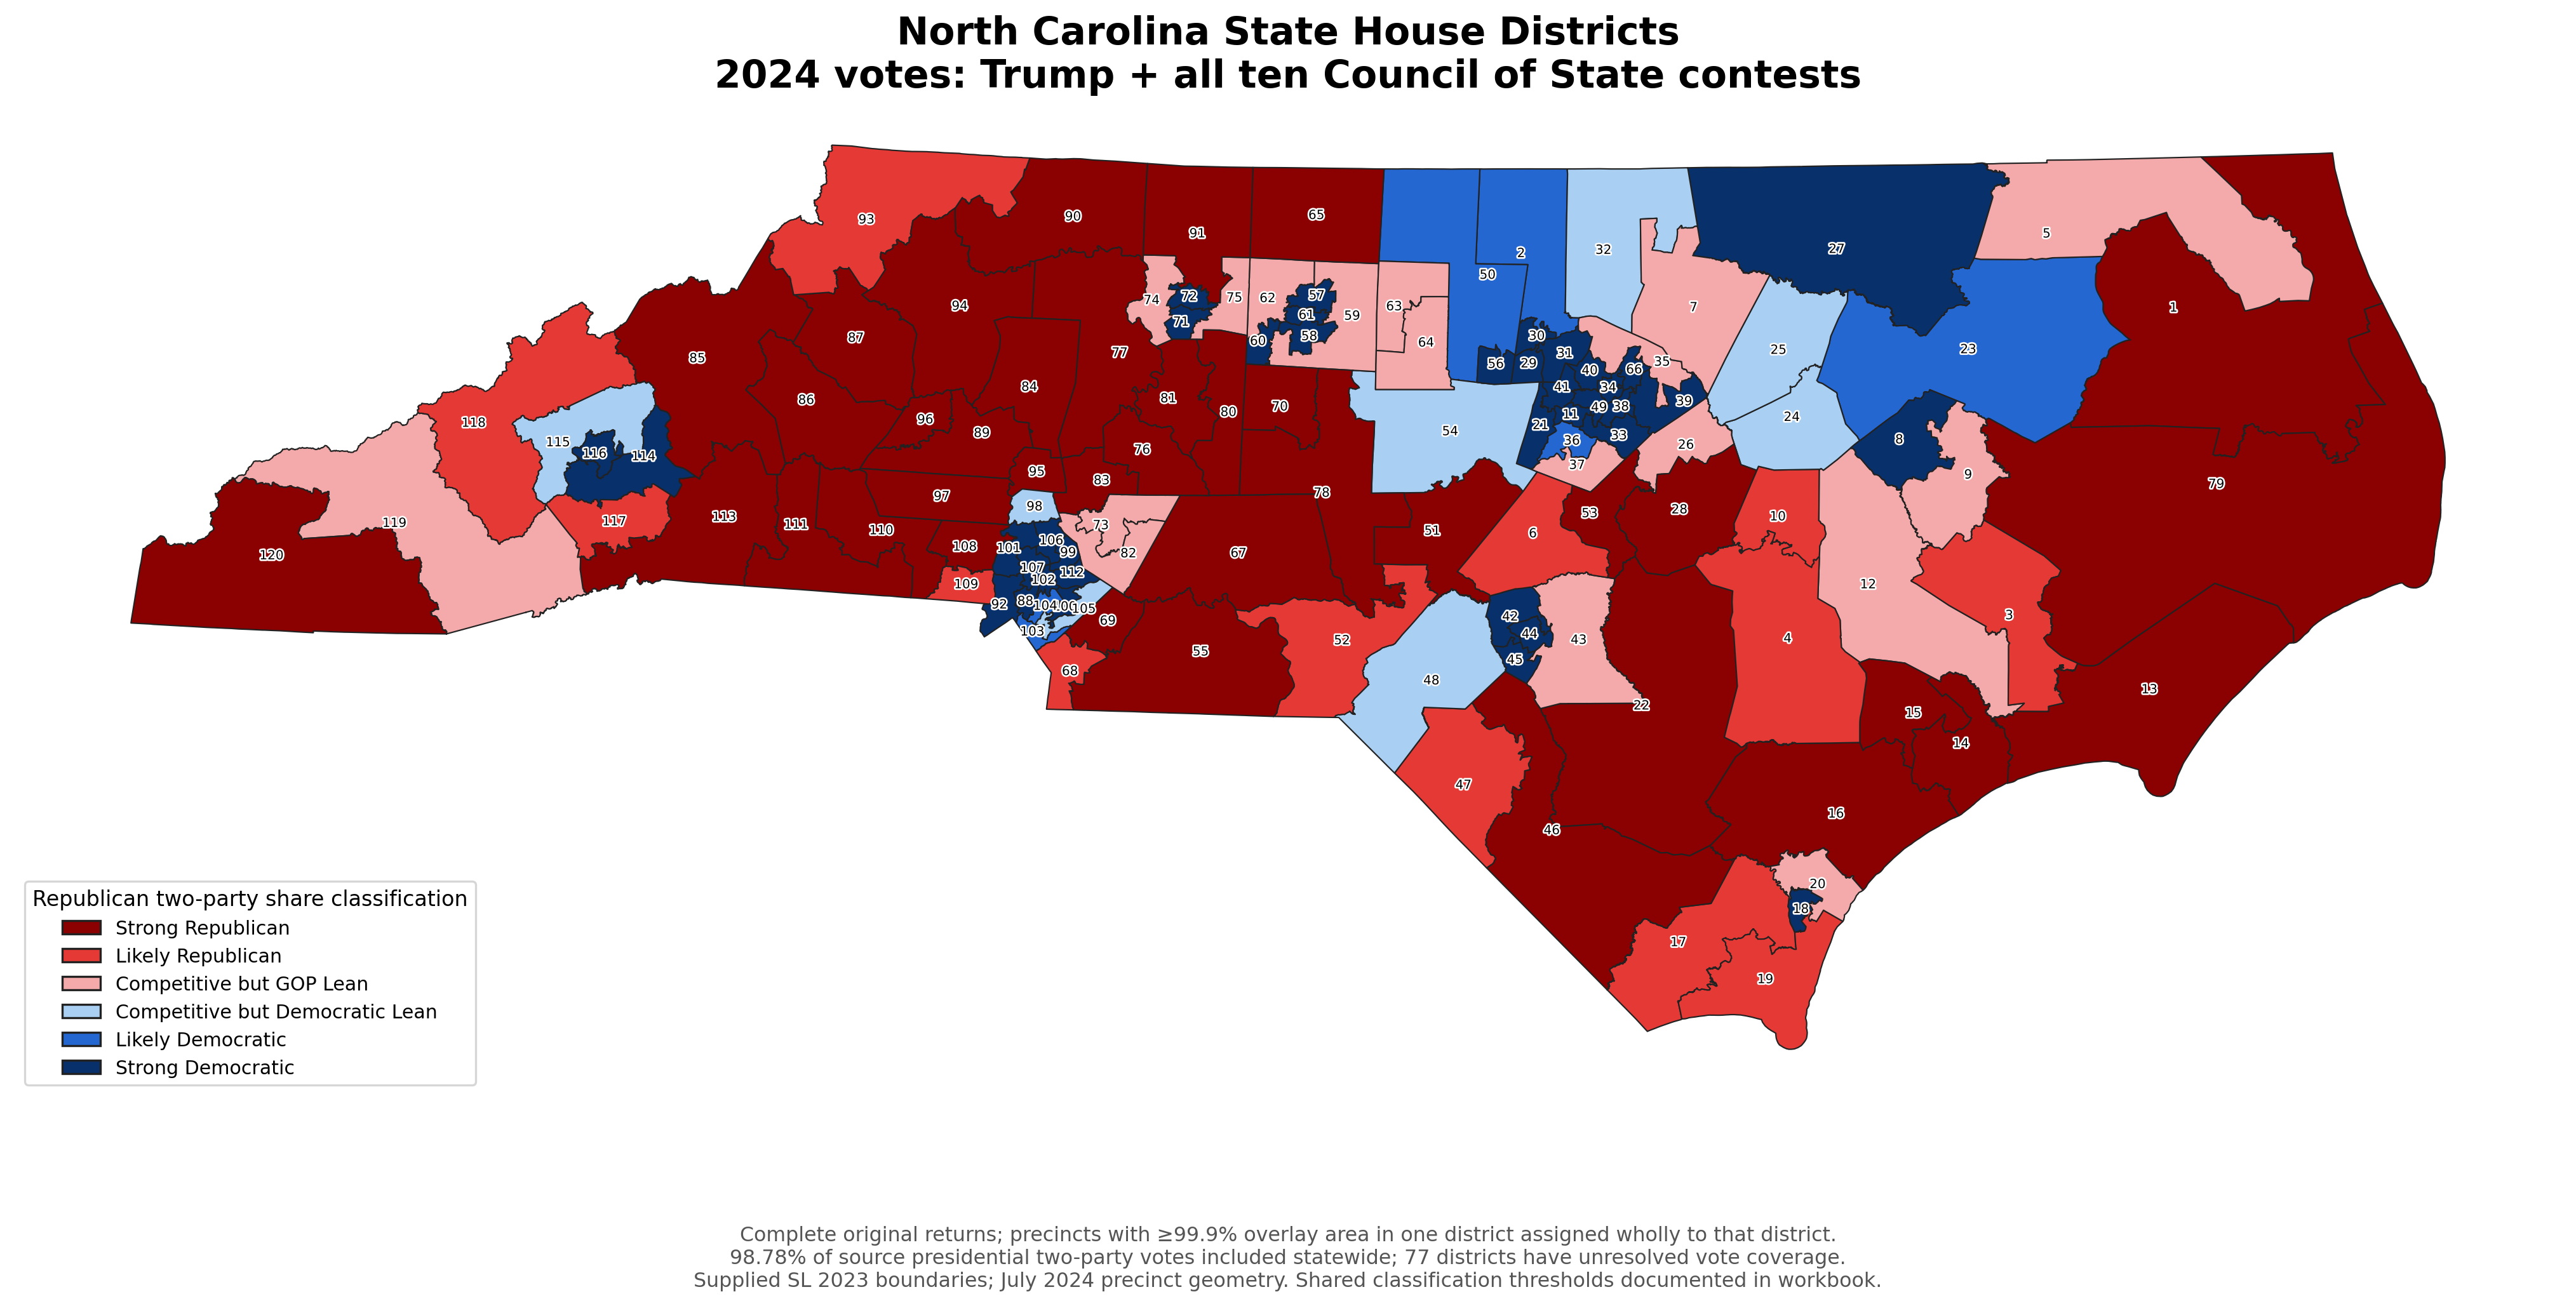
In summary, here are the potential distributions across the four measurement categories for the N.C. House:
And for the 50 N.C. State Senate districts comparing the Trump only to All Contests measurements:
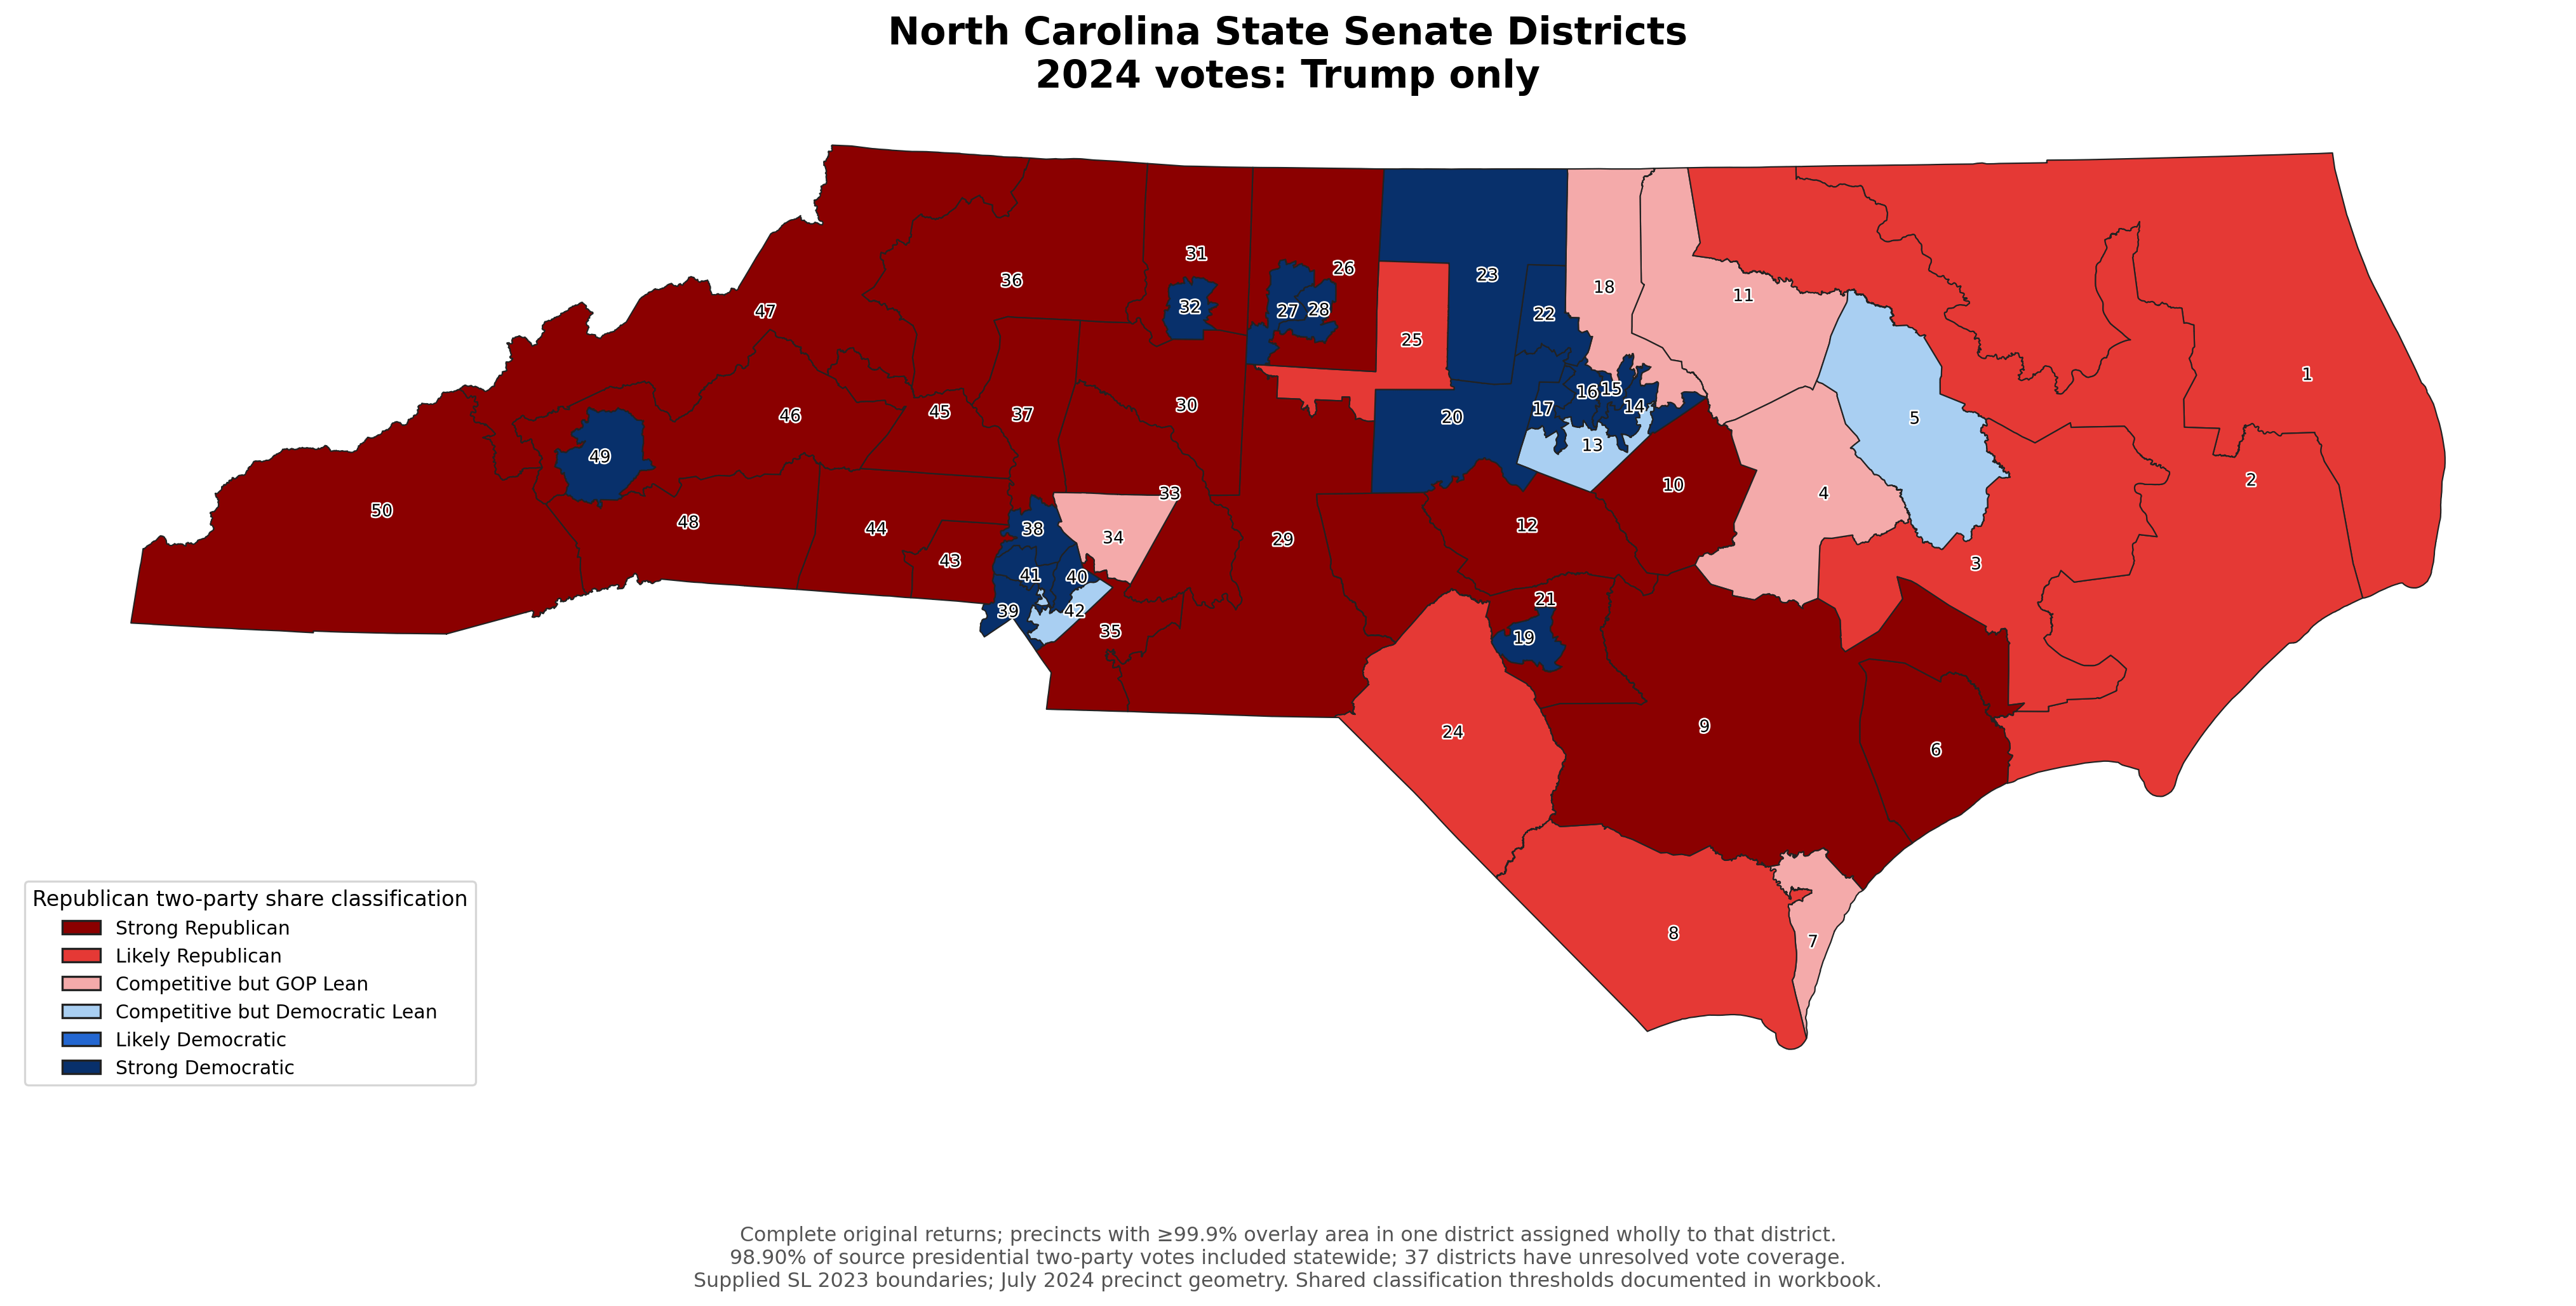
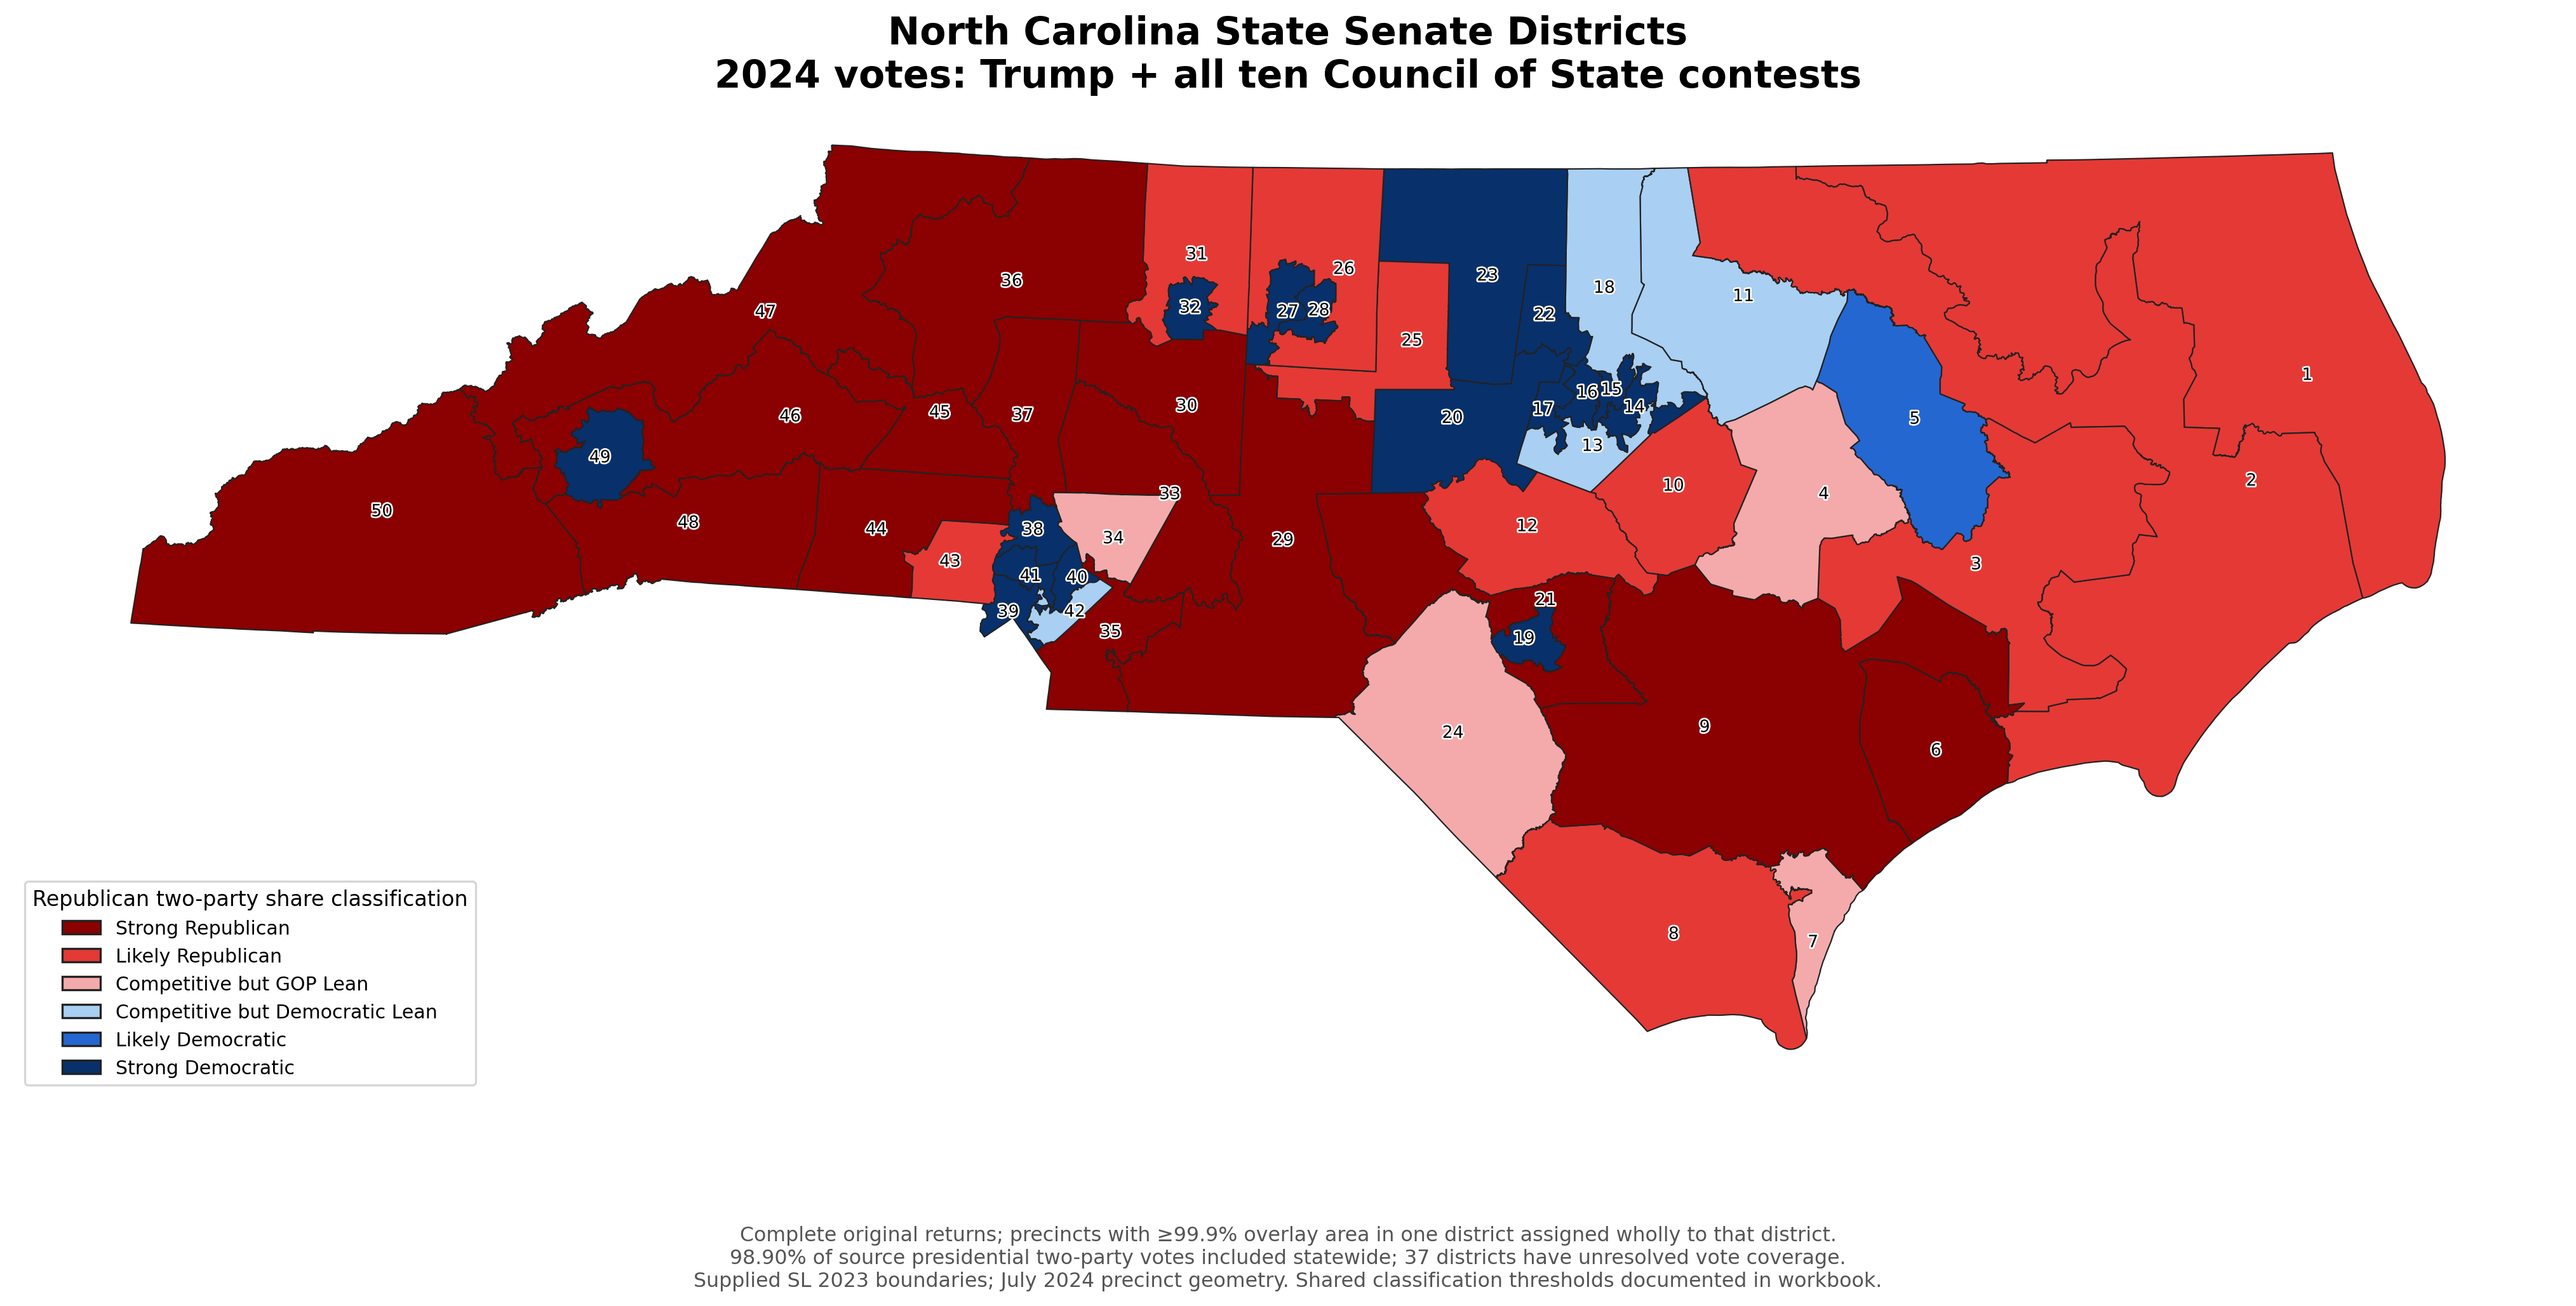
And the summary within each electoral measurement for the distribution of senate districts:
Notice the shifts from one chamber’s classifications from one measurement to the next.
Let’s take a look at each chamber and the potential competitive districts within each.
Likely Solid/Strong Partisan Districts:
Using the Trump-only district electoral measurement that are 60% or greater, 46 N.C. House districts fall into this category. And while four of those districts move into the competitive band (less than 55% thanks to the Trump-Robinson measurement), the vast majority stay at 57% or greater Republican across the four measurements.
On the flip side, 34 House districts are strong Democratic, with none of them moving any direction among the measurements—they only grow ‘more Democratic’ with each measurement.
For the N.C. State Senate, 20 districts are 60% or great on the Trump-only measurement, with most of them staying either solidly or likely Republican. Only one district—10—moves into 55.6% based on Trump-Robinson measurement, but rebounds to 59% with the Council of State elections included.
On the other side of the political aisle, 16 districts are solidly Democratic. If you want the heat map charts for these districts, click on these links for the NC House Republican and Democratic districts and and here for the N.C. Senate Republican and Democratic districts.
The Likely & Competitive NCGA Districts
For those districts that are in the likely band (55-59%), most of them tend to stay in that range across the four measurements, with the exception of the Trump + Robinson measurement that significantly brings the district’s electoral measurements more Democratic.
But within the ‘competitive but lean to one party’ category (50-54%), there are some significant shifts across the four measurement categories. First, for the N.C. House:
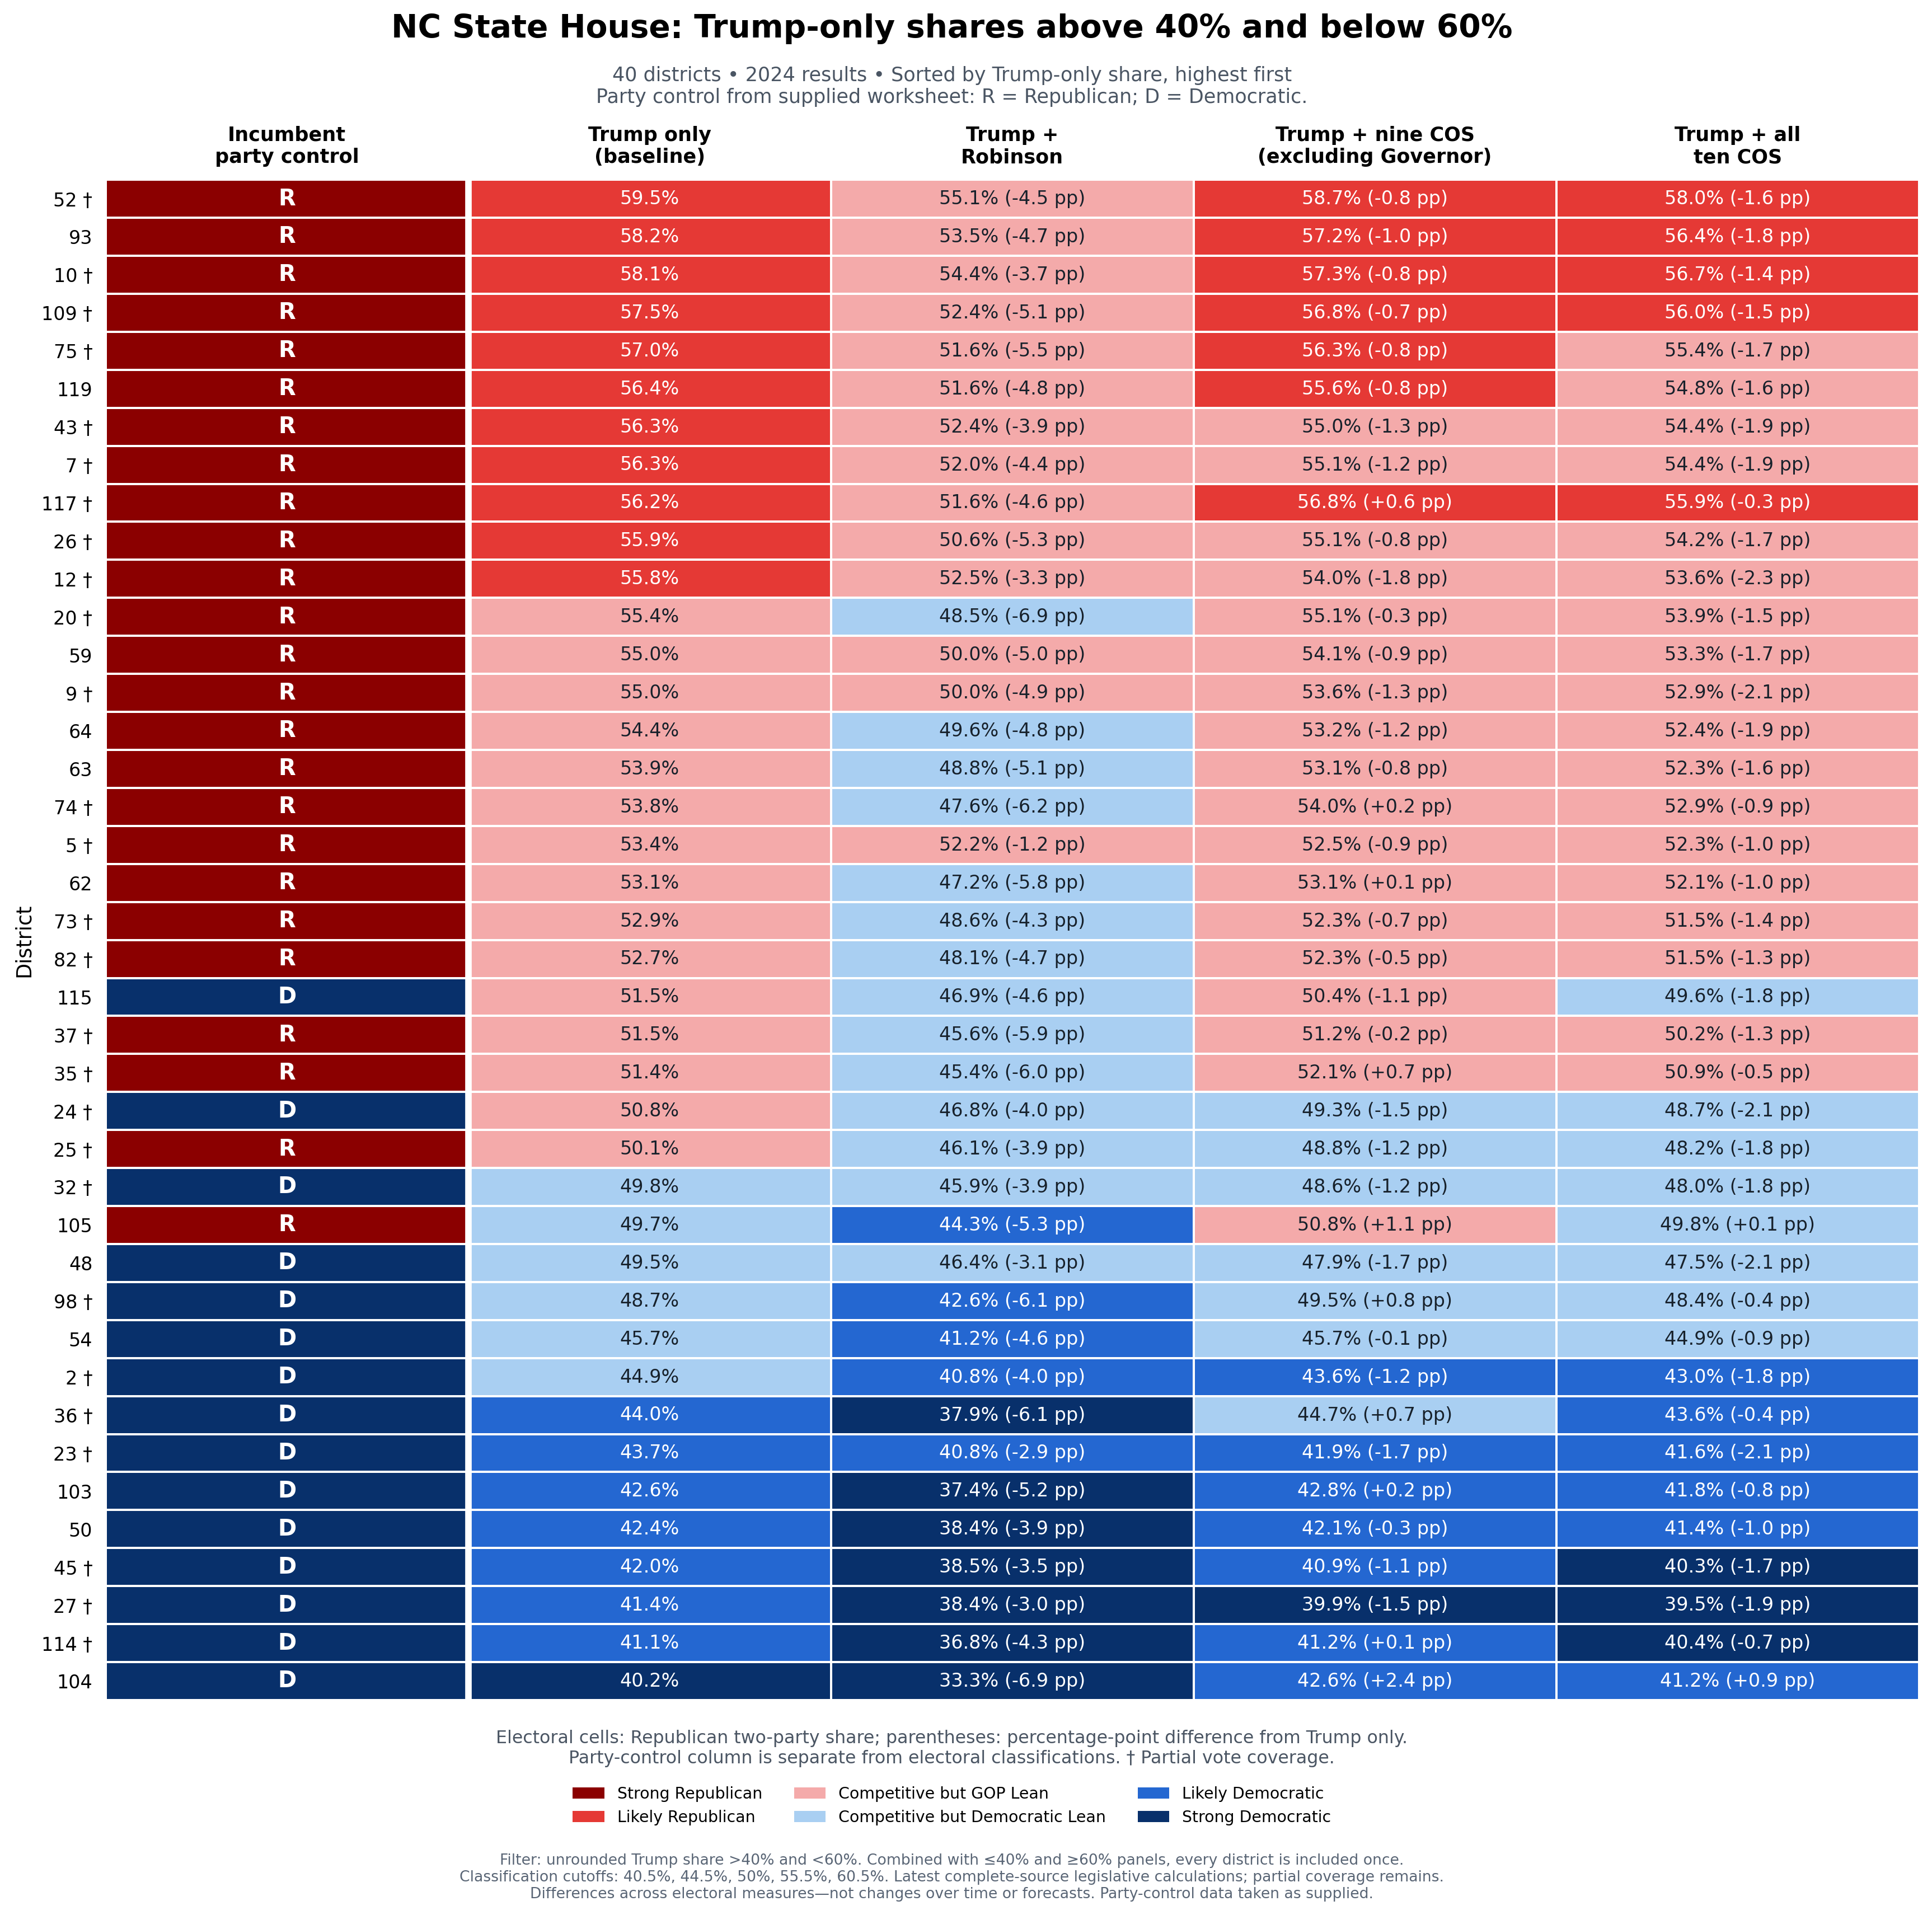
Going from top to bottom, I would point to the beginning of the ‘cracks’ in these districts with House District 20, where it is right at 55% for Trump-only, dips into light blue for Trump & Robinson, and returns back to competitive but lean Republican (below 55% for the all-contests measurement (right at the cusp at 54%)).
At the bottom of that range, House District 105, represented by Tricia Cotham1, illustrates how much the choice of electoral measure can matter. Under the Trump-only measure, the district appears more Republican than it does under the broader set of statewide contests. The Trump-plus-Council-of-State measure is the only one of the four that gives Republicans a majority in the district, while the all-contests measure places the district just below 50% Republican. That difference does not predict the outcome of the House District 105 race, but it does show why a single electoral baseline can obscure a district’s potential competitiveness.
From House District 20 to 105, there are 17 districts, with three held by Democrats and fourteen held by Republicans. With a focus on Republican-held districts, here’s a map of these 14 GOP districts based on the all-contest measurements:
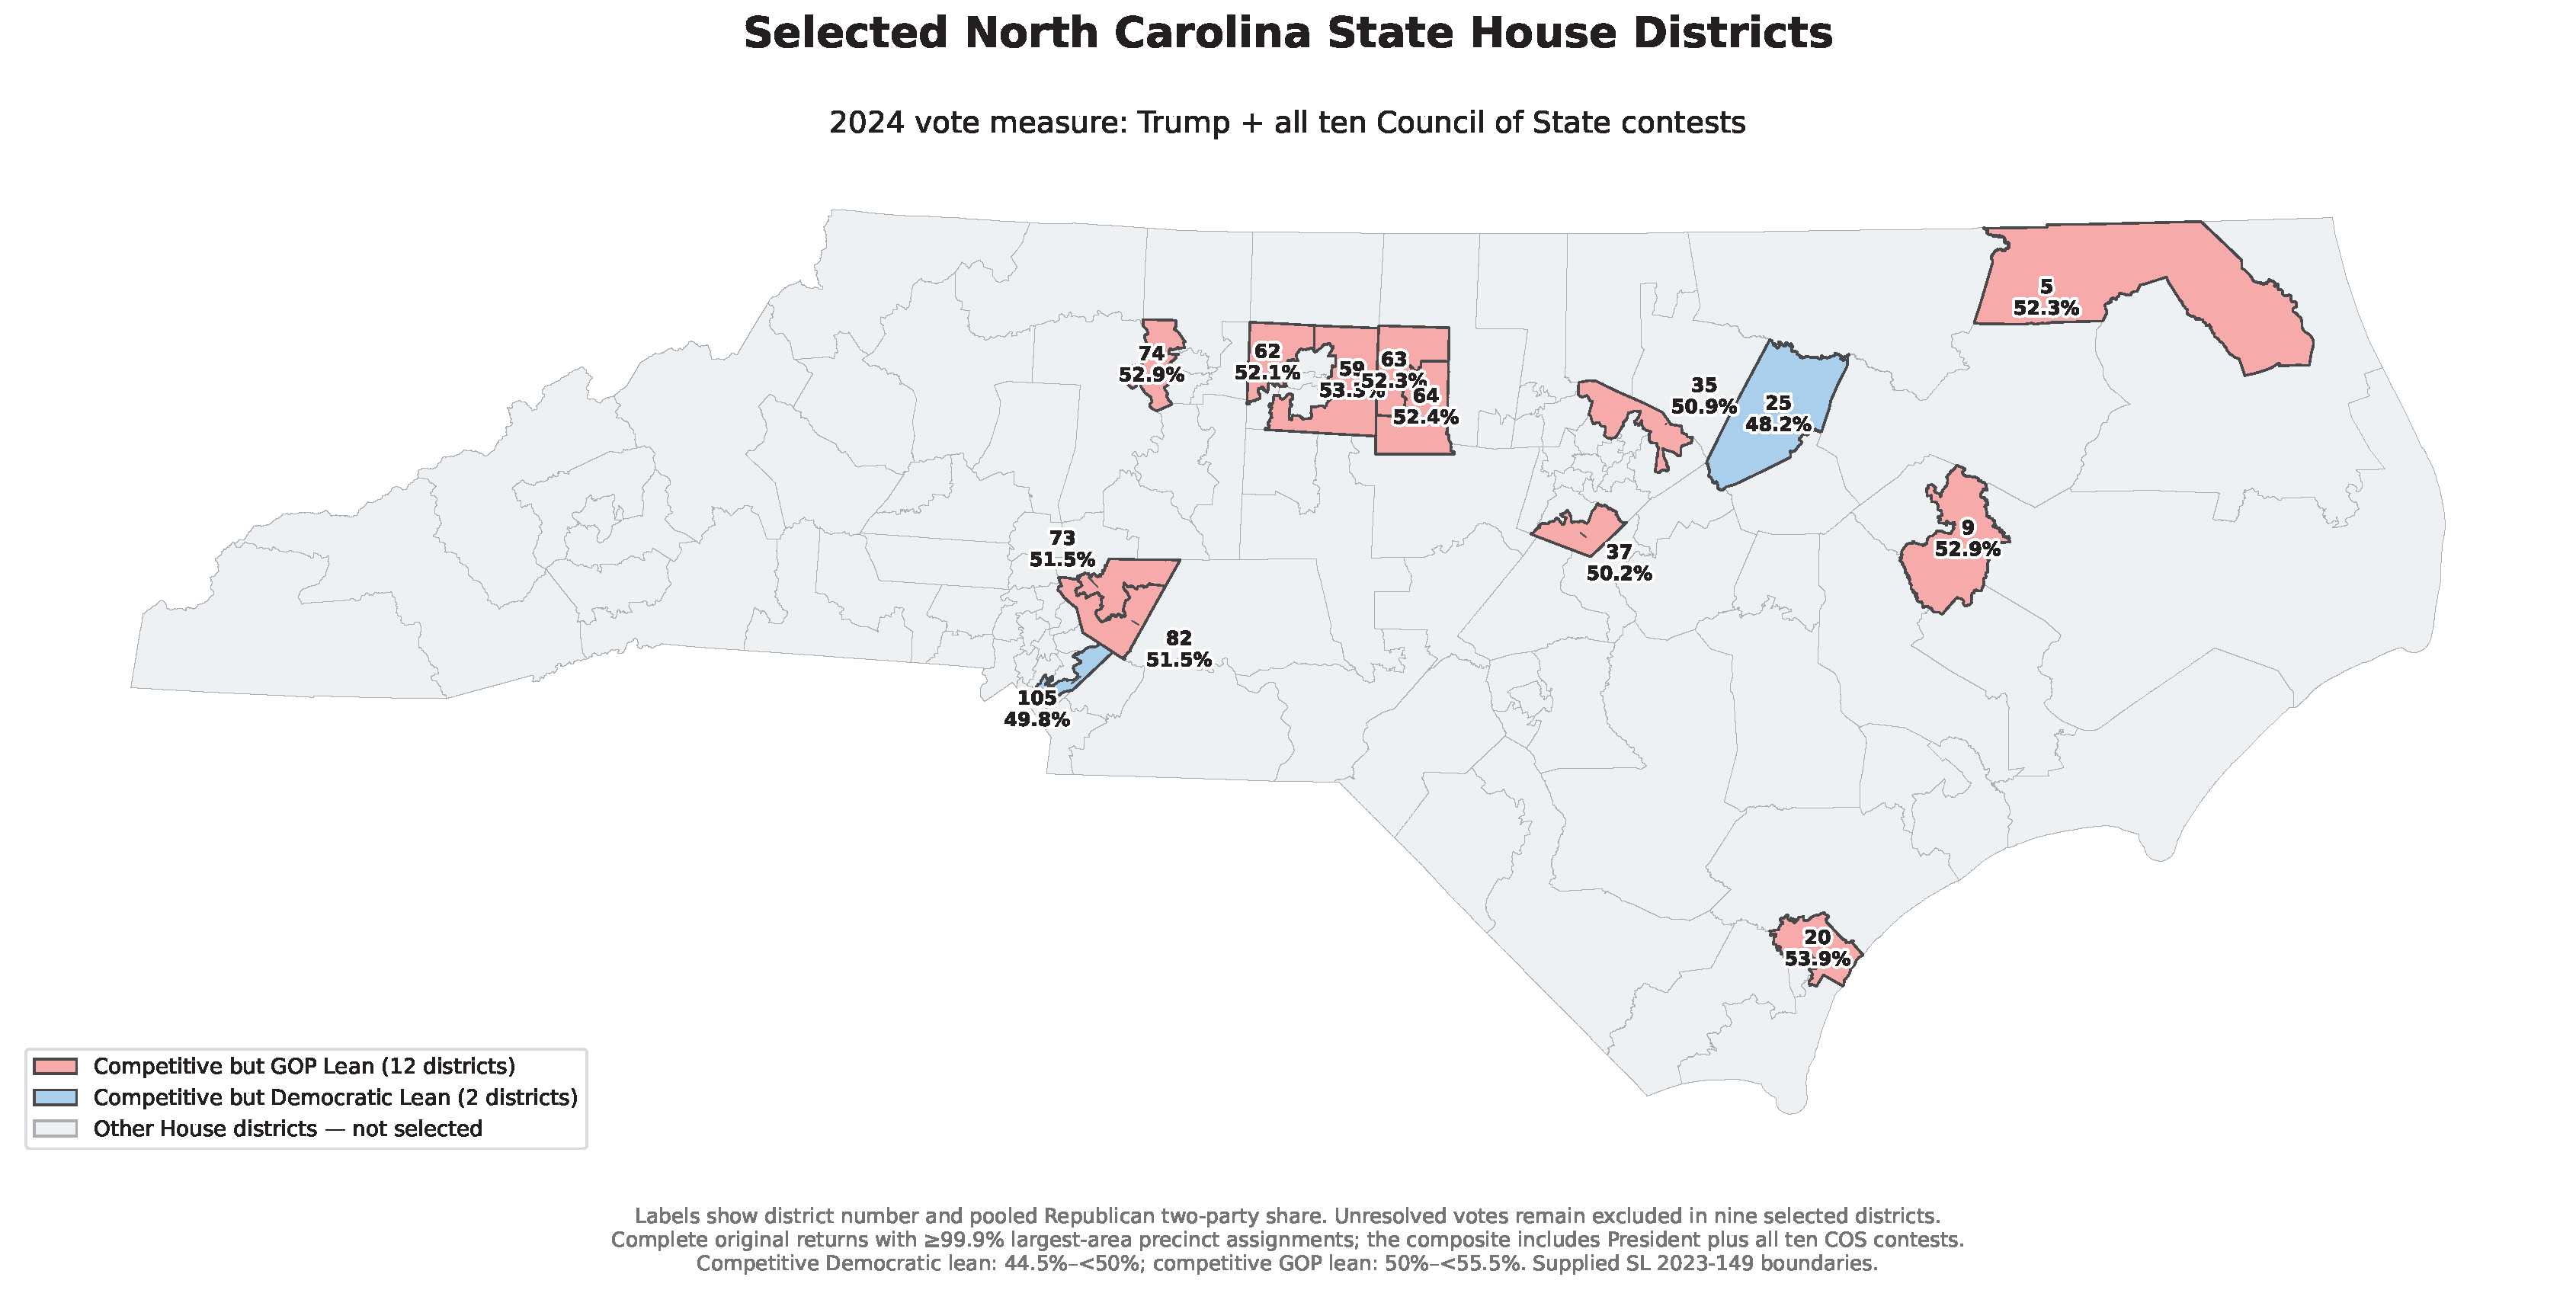
A significant number of these potential competitive GOP districts are in urban and suburban surrounding counties: Cotham’s 105 in southern Mecklenburg County, along with neighboring Cabarrus County’s Districts 73 and 82. The Piedmont Triad has a number of districts, including Forsyth’s (Winston-Salem) 74, Guilford (Greensboro) with Districts 59 and 62, and Alamance’s 63 and 64. Wake County’s urban suburban districts of 33 and 37 are noted, along with Nash’s District 25, Pitt County’s District 9, and New Hanover’s (Wilmington) District 20. One district—5—is in the upper northeastern section of the state.
In general, these share common aspects: all but one district have a plurality of voters who are registered unaffiliated (half at or above the state’s 40% registered unaffiliated):
Two-thirds of the combined house districts’ voters are white non-Hispanic:
And these districts mostly have their voters in urban suburbs:
These demographic characteristics help describe the districts, but they do not independently establish how voters will behave in November. Unaffiliated registration, racial composition, and suburban geography are useful context for understanding the electoral landscape—not substitutes for evidence about individual voter preferences or turnout.
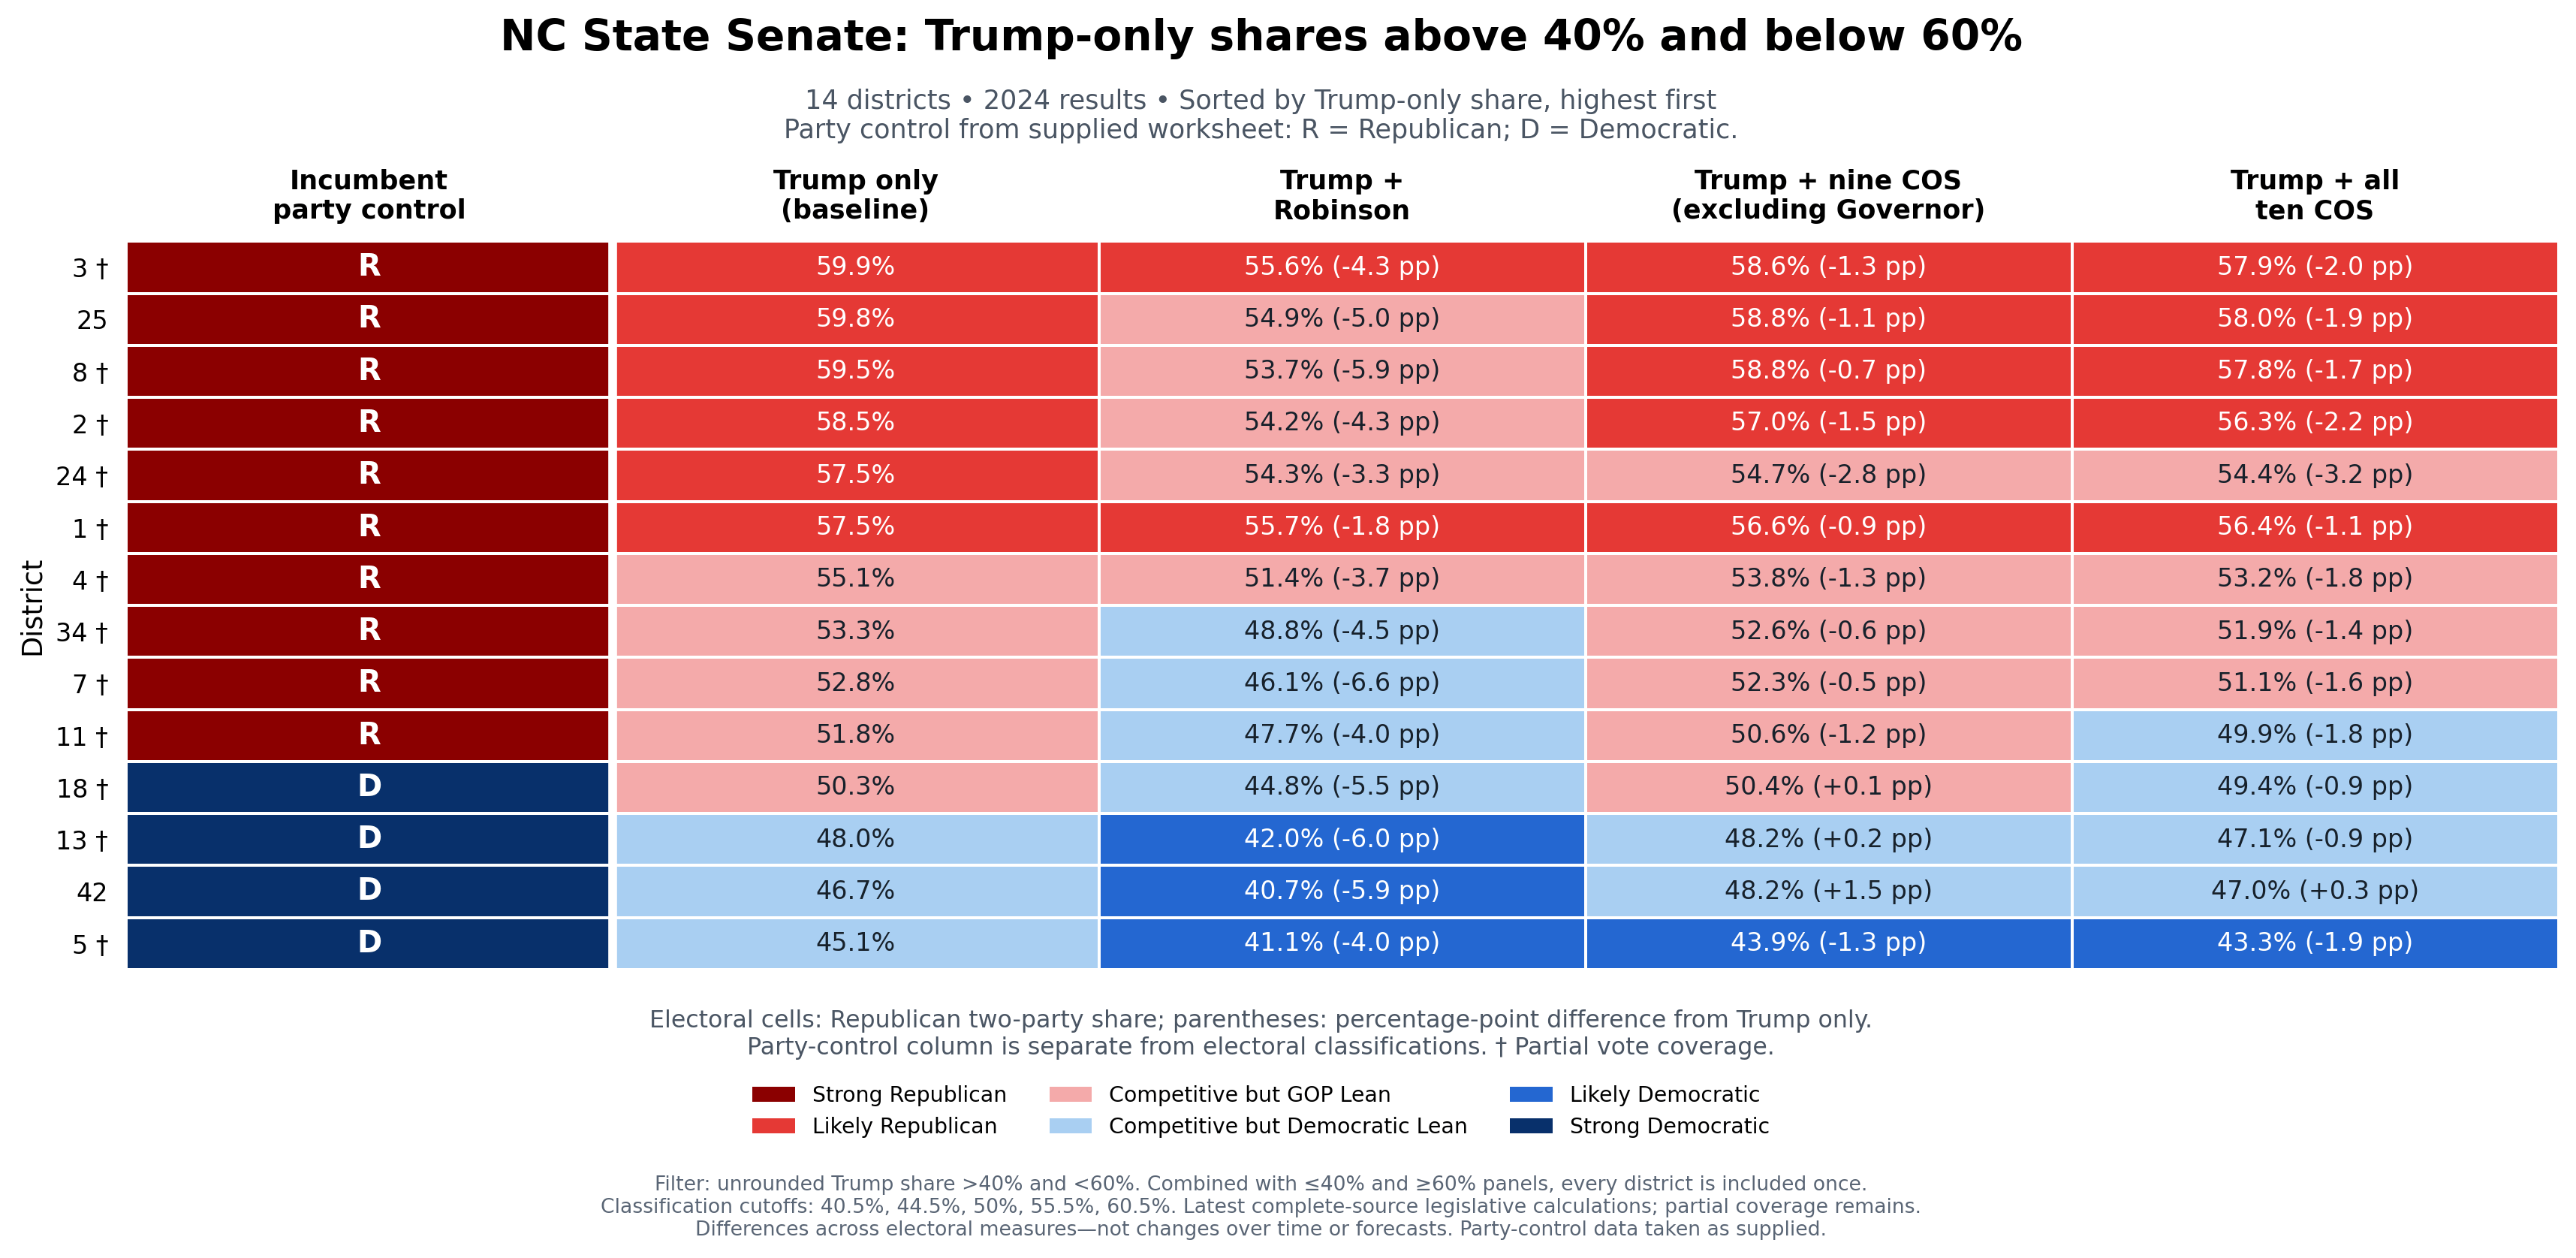
For the state senate, four districts are within a competitive but lean GOP range: District 4 made up of three counties; New Hanover’s District 7; District 11 that includes three counties around Wake County; and Cabarrus’ District 34. Based on three of the four measurements, senate district 24 could also be a candidate, but I’ll focus on the first four.
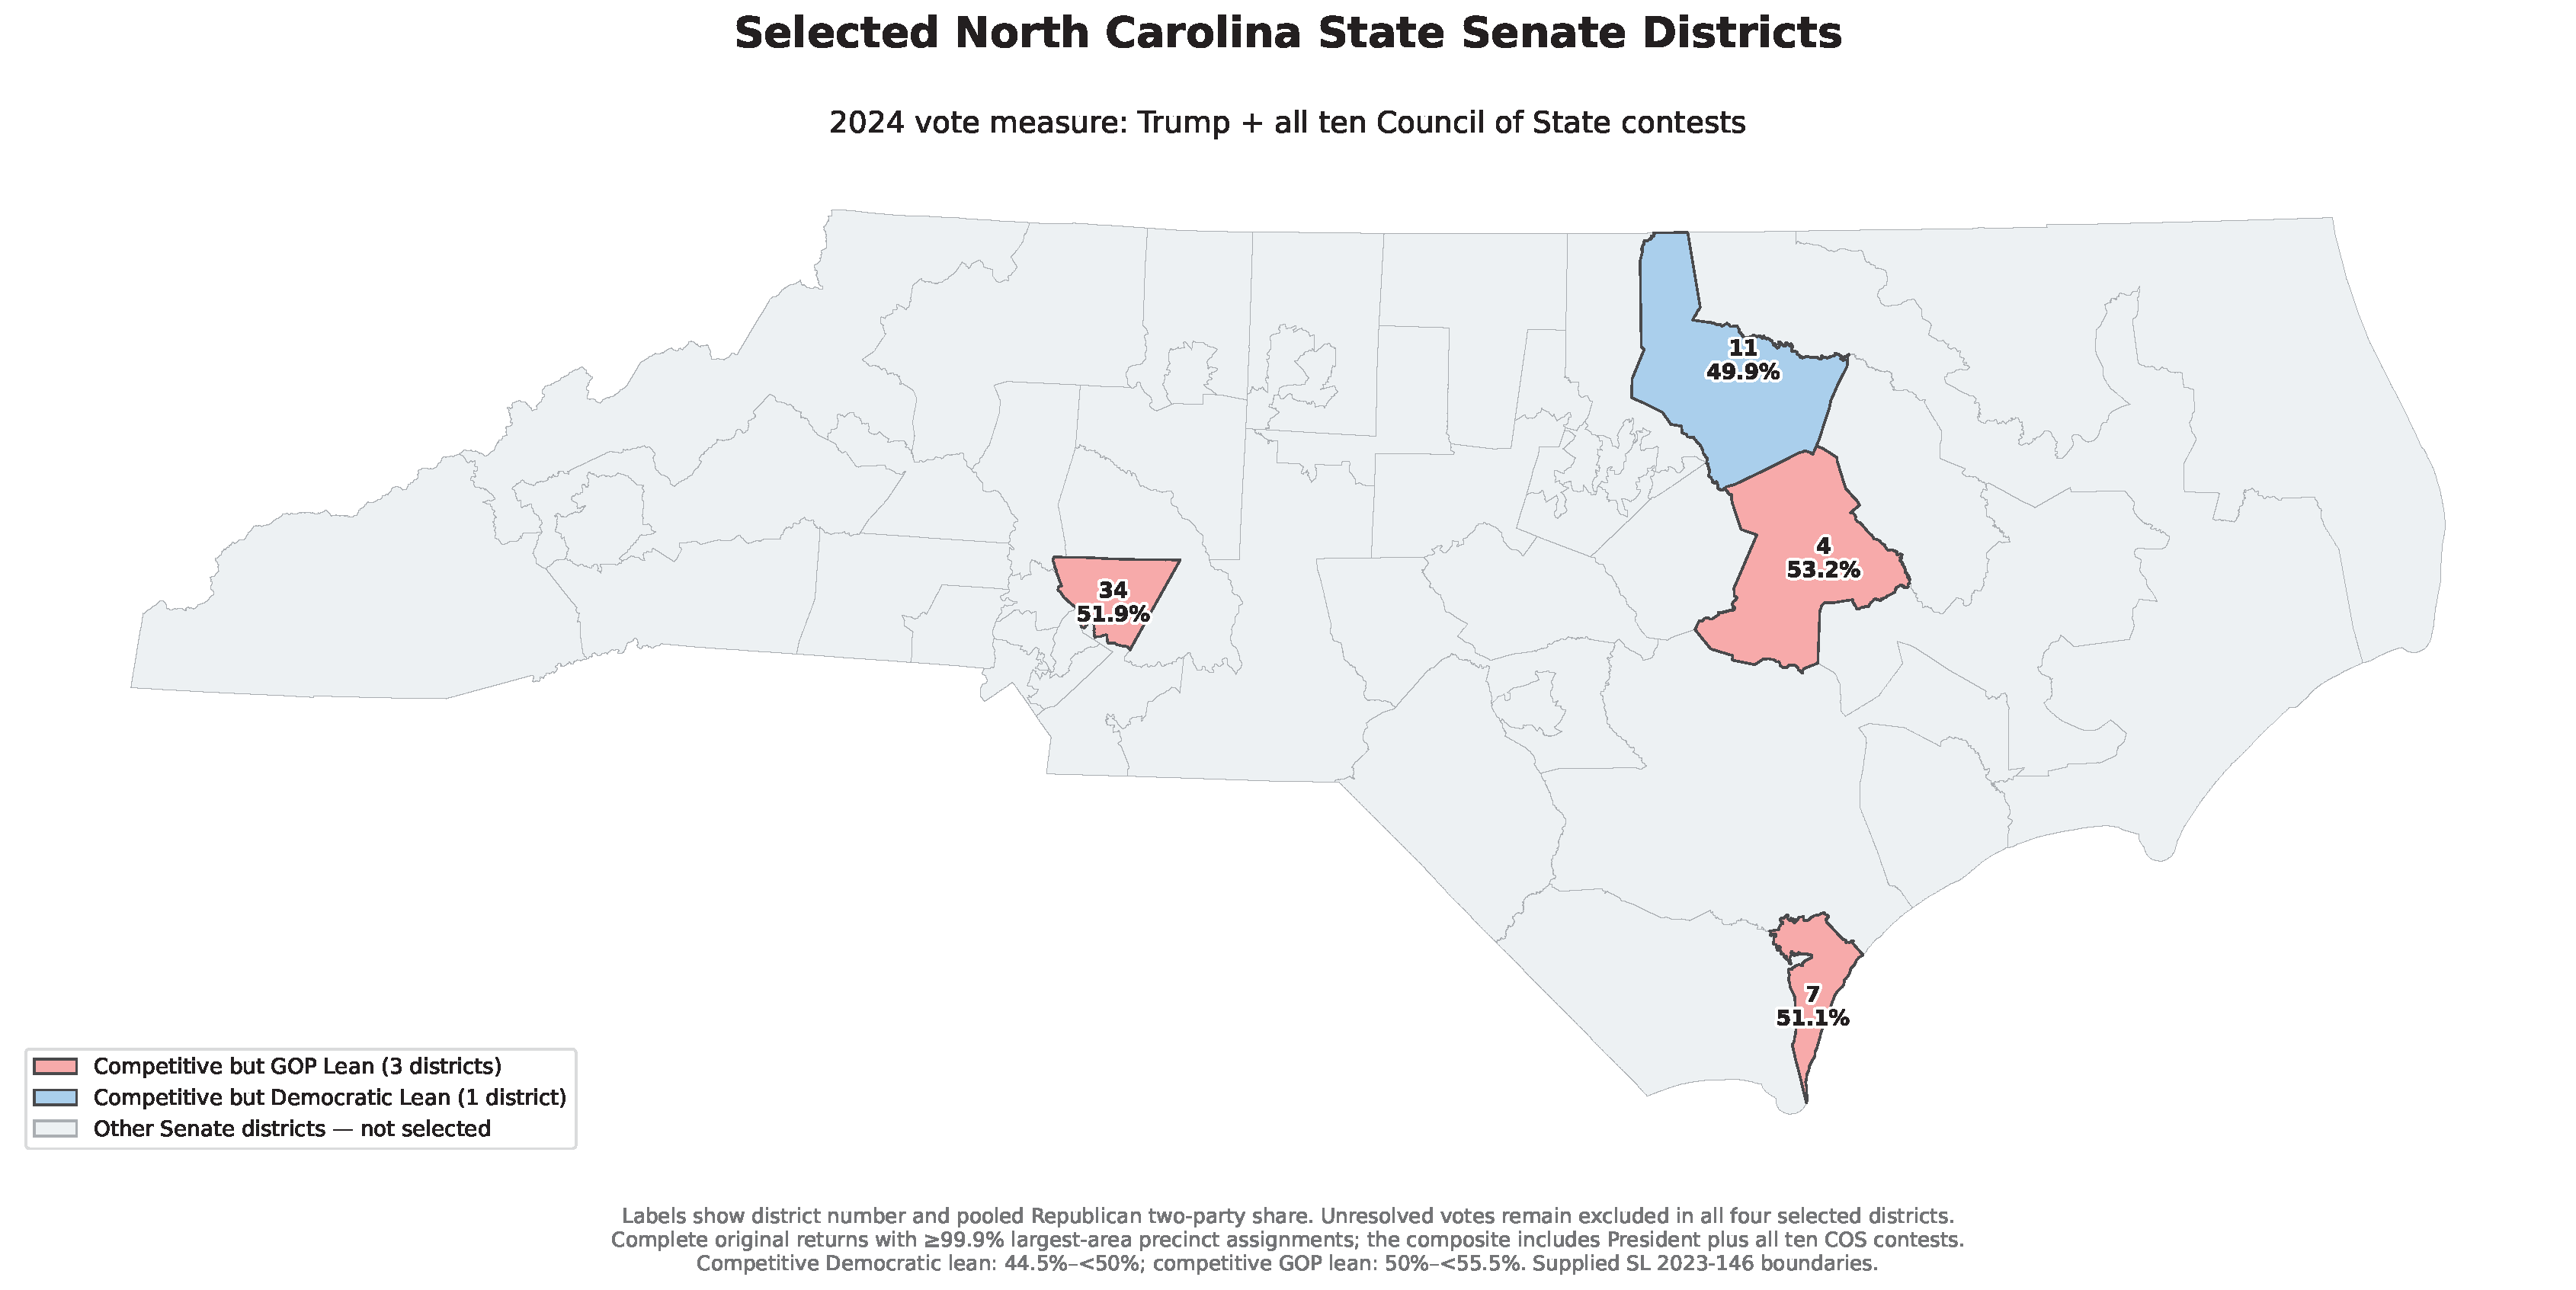
Again, these districts tend to follow the same dynamics as the house districts, notably that registered unaffiliated voters are pluralities in all four:
The four senate districts are majority white, but not as white as the house districts:
And very much suburban in voter composition:
So What Does This Mean for the NC General Assembly in 2026?
Much like with the U.S. House analysis, the central question for the North Carolina General Assembly is whether the 2026 midterms produce a meaningful shift toward Democrats—and, if so, how far that shift extends across the legislative map.
In the N.C. House, Districts 105, 25, 35 and 37 stand out as the four districts where the all-contests measure places Republican performance at or below 50%. These are useful starting points for assessing whether the electorate has moved toward Democrats. If Democrats make gains in these districts, the results could offer early evidence of a broader shift, although the size and distribution of any gains will matter.
The N.C. Senate presents a related test. Four Republican-held districts—4, 7, 11 and 34—appear competitive but lean Republican under the analysis. Democratic victories in these districts would put greater pressure on the Republican majority, while Republican holds would suggest that the party’s advantages remain resilient in this environment for potentially vulnerable seats.
The four electoral measurements do not tell us what will happen on November 3. They do, however, help identify where to look first once the polls close. As the returns come in, the results in these districts—and how they compare with the broader statewide electoral environment—will help us assess whether North Carolina is experiencing a modest partisan shift or a more consequential change in its legislative politics.
For all of these competitive districts, could they be the first measurements of how big the blue wave/strong the red rip tide is, and what kind of beachhead the Republicans have built in to blunt the force of those currents?
November 3rd will give us the true understanding of this year’s mid-term district dynamics.
Cotham switched parties in 2023 to give the Republicans a super-majority in the House in that legislative session.
So basically what you’re saying is that only four districts in the state House and Senate could switch (flip) because of previous gerrymanders