

By Michael Bitzer
As North Carolina heads into the final weeks of the 2026 midterm elections, one question looms over the state’s congressional races: how much of a Republican advantage will the district lines provide in a political environment that appears to be shifting toward Democrats? Looking at past election results offers a useful baseline, but the choice of which previous elections to include matters.
As I’ll explore, measuring district performance across all 11 statewide contests in 2024 suggests that both the First and Eleventh Congressional Districts are competitive—and that even a map drawn to favor Republicans may not fully insulate the party from a broader Democratic wave.1
Beyond the dynamics of a simple ‘generic ballot’ analysis, political scientists and analysts usually rely on past election results for determining how “Republican” or “Democratic” a district or area is. One advantage to this analysis is that American voters have become calcified in their voting patterns: meaning, what vote percentage a county (for example) has in one year’s election, there’s a pretty close relationship to the next election being in that same area.
Here’s North Carolina’s county-level Republican percentage for the 2020 presidential two-party vote (horizontal) compared to the 2022 Republican U.S. Senate two-party vote percentage:
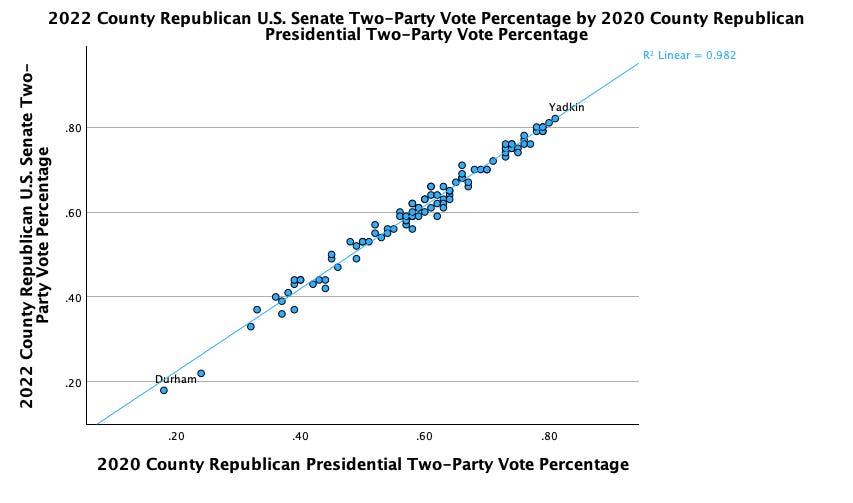
While there’s some movement from one election to the next (not all the dots (counties) are on the line), the relationship is very close: statistically, 2020’s Presidential Republican percentage explains 98% of 2022 US Senate Republican percentage.
And it’s not just the next election every two years, but the four-year presidential to presidential election cycle that demonstrates the same pattern:
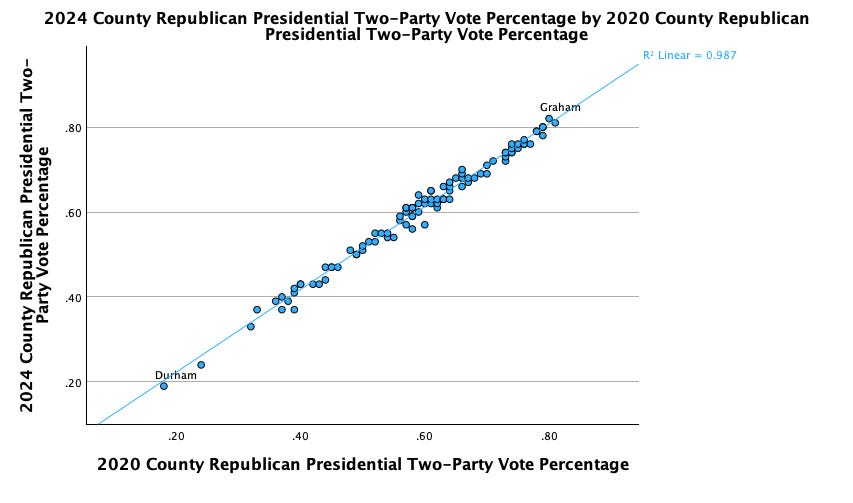
Again, a pretty tight clustering around the line tells us that once again, the 2020 Presidential Republican county percentage explains 98% of the 2024 Presidential Republican county percentage.
So, if we take just the Trump percentage and break the precinct voting results into each congressional and state legislative district, we might have a pretty good baseline dynamic for each district and its voting behavior. As a reminder though: a district’s partisan baseline tells us potentially where the contests starts—not necessarily where it will finish.
Here’s the 2026 U.S. House district map for North Carolina, with each district’s Trump-only presidential performance:
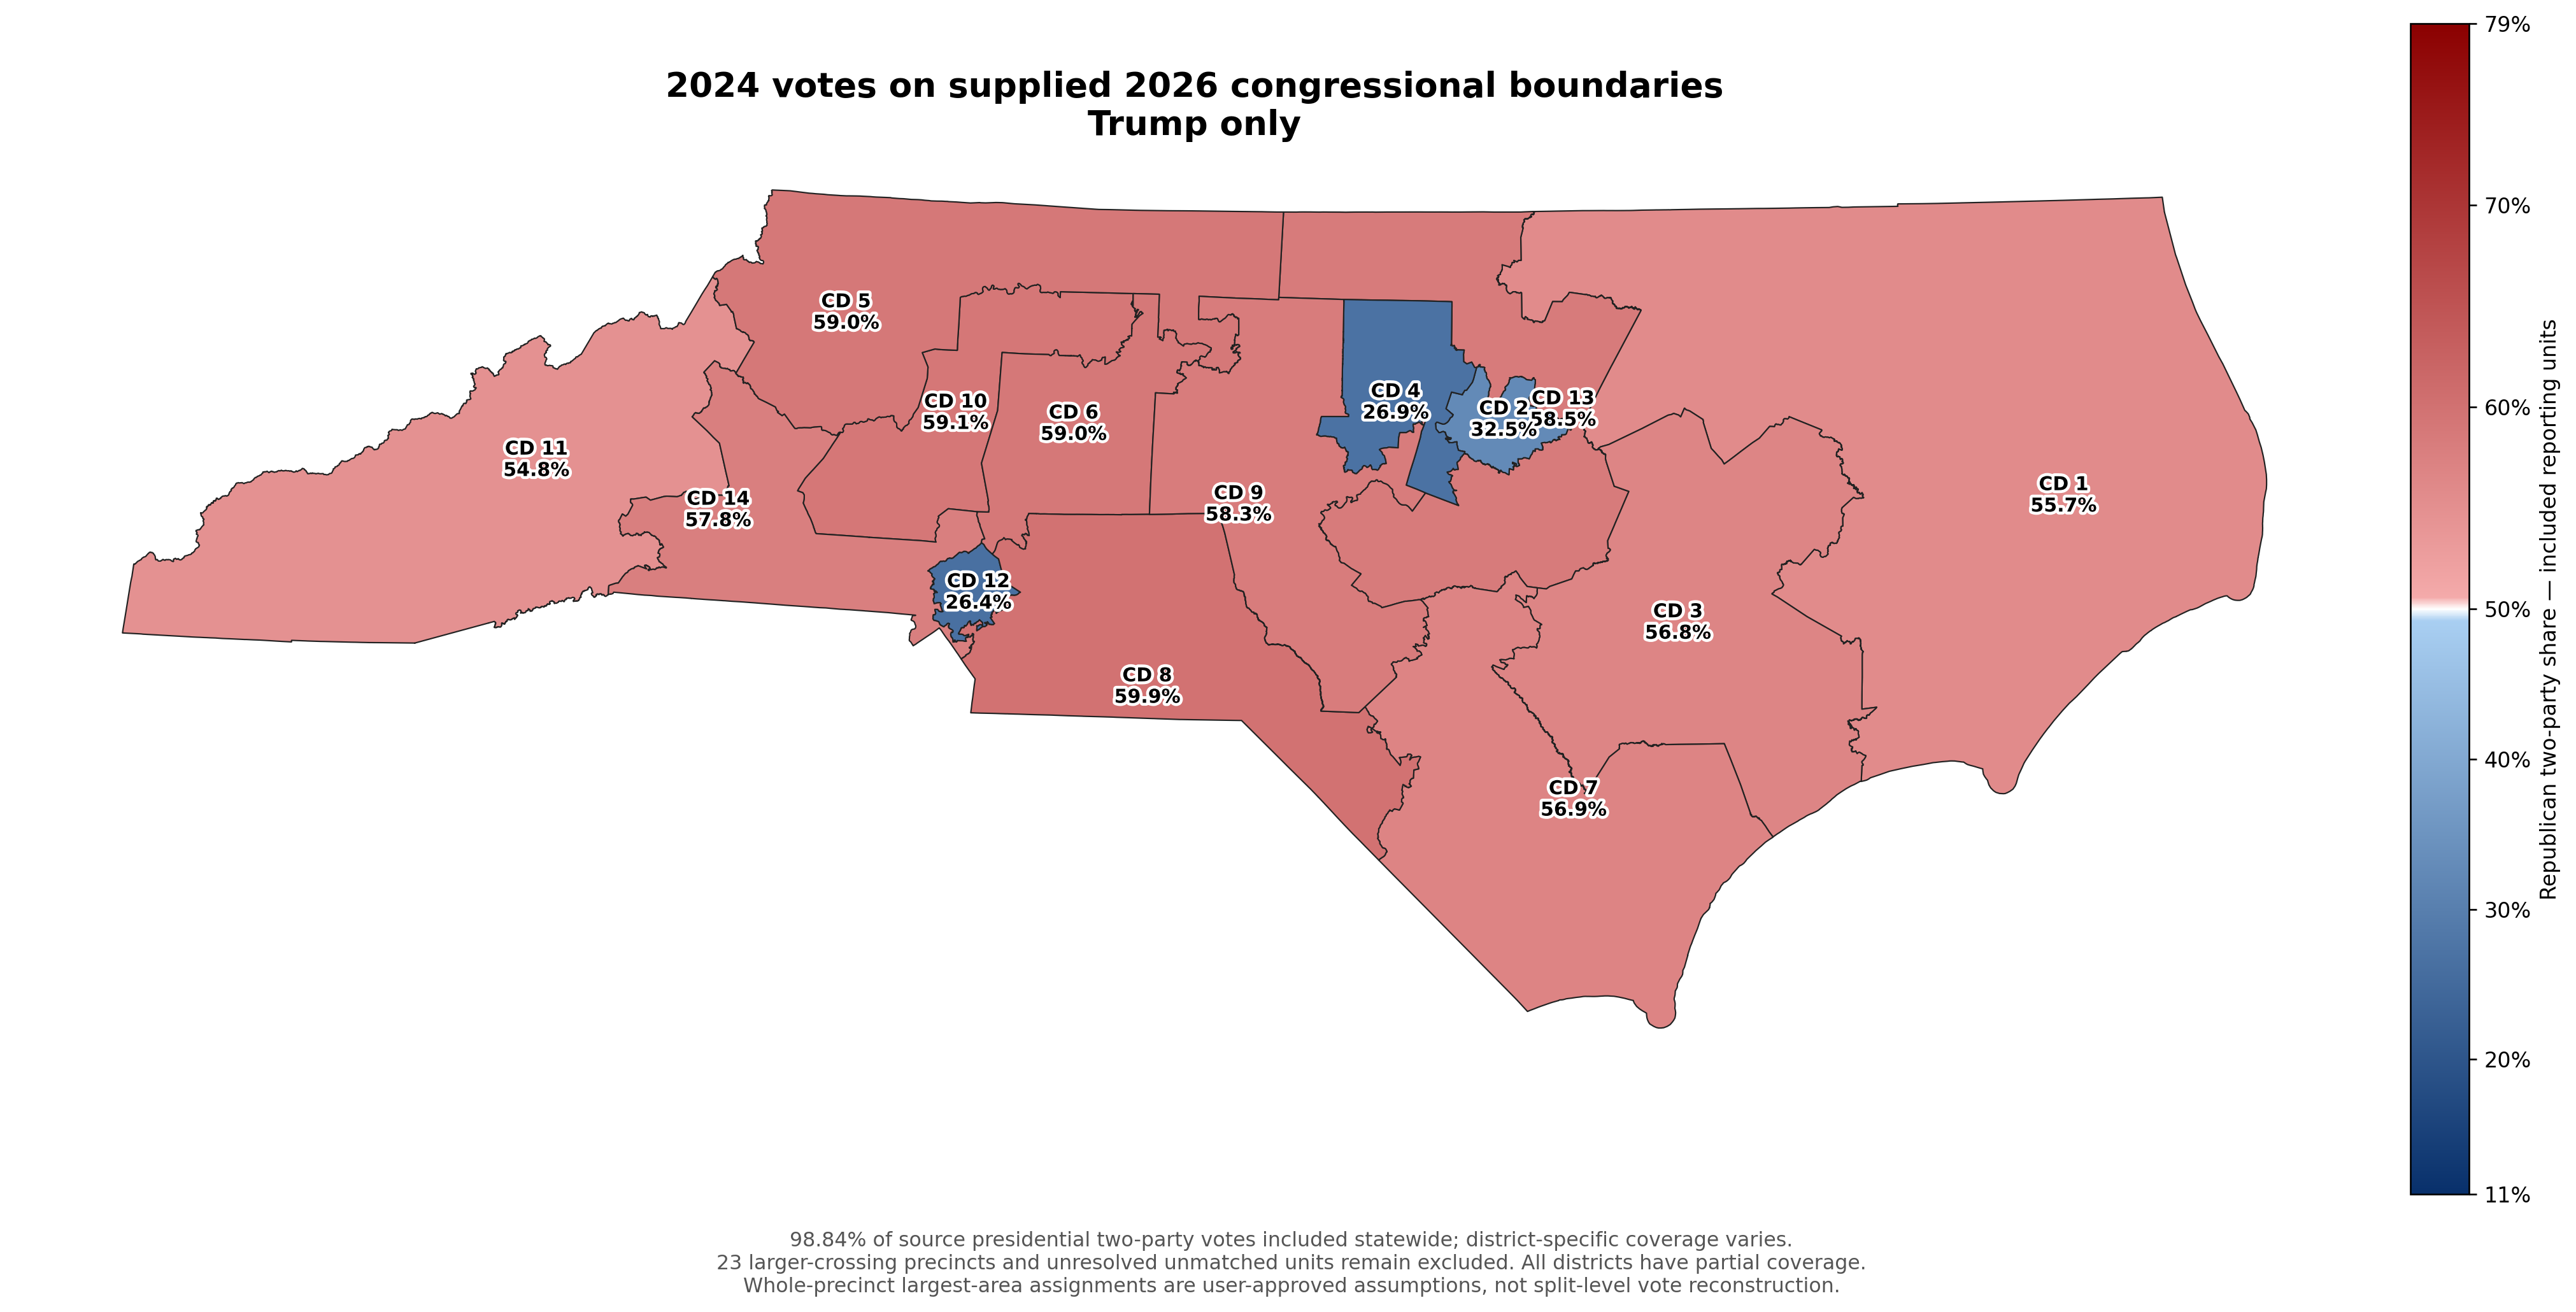
Notice the three dark blue Democratic districts, with the 12th being the lowest Trump performance at only 26.4%. The eleven other districts have Trump above 50%, with the Eleventh District at 54.8% going up to the almost 60% (59.9%) in the Eight District.
The Eleventh and the First are the two districts being closely watched in the state and nation for what could be potential competitive districts in North Carolina. In fact, this morning as I was writing this post, the Cook Political Report moved a good number (18) U.S. House districts towards the Democrats, including the First from Lean Republican to Toss Up (the Eleventh was already a Toss Up status in their calculations).
So, if we think 2026’s election will replicate 2024’s electoral dynamics, we would expect Republicans to garner 11 seats, claiming both the Eleventh and the First.
But here’s where ‘one election isn’t necessarily a repeat of the previous election’ dynamic comes into play. Republicans are facing a hard cycle: the September Catawba-YouGov Survey has the U.S. House generic ballot at a Democratic +9, meaning likely voters are intending to vote nine points more Democratic than Republican.
So even with the lines of partisan gerrymandered districts creating a friendly Republican field of districts, the one thing that district lines can’t overcome is the political ‘mood’ of the state and nation: and that is decidedly Democratic this year.
What about a pro-Democratic contest in 2024 to baseline the districts?
In North Carolina’s 2024 election, we had both a presidential and slate of contests down the ballot, most notably a gubernatorial race between Democrat Josh Stein (current governor) and Republican Mark Robinson. Stein achieved a rarity in North Carolina elections, with a nearly 15-point win over Robinson.

With this election combined with the presidential election, we see a notable shift in the congressional districts’ baseline dynamics:
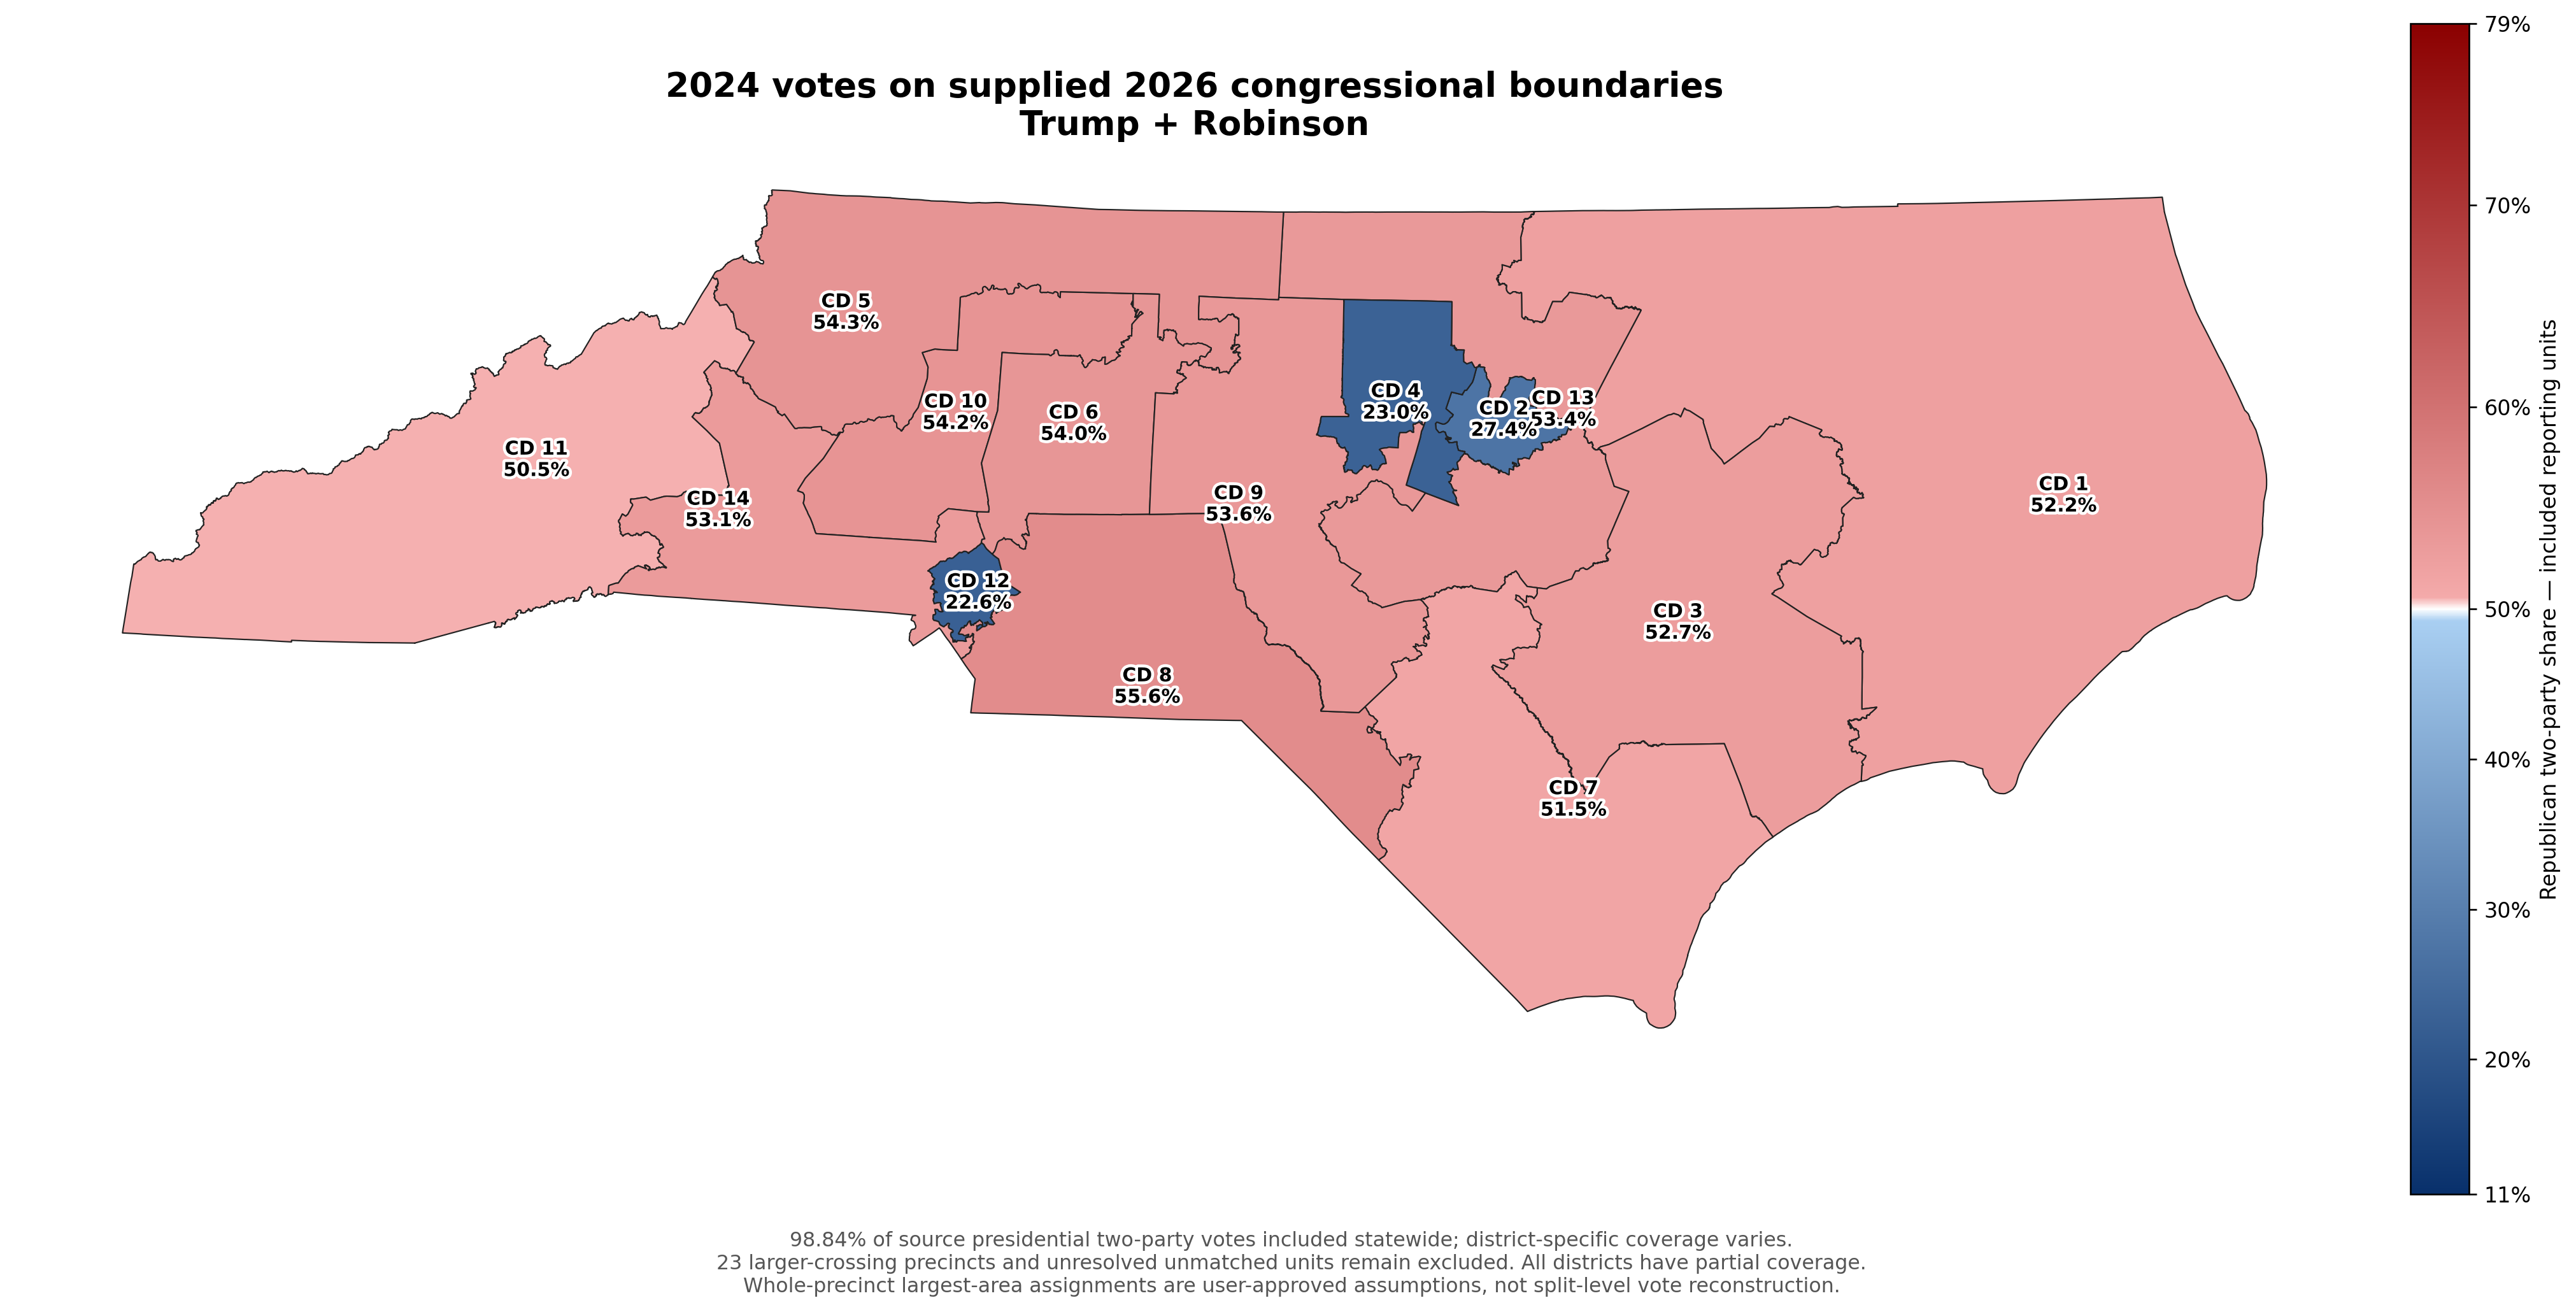
The Eleventh drops from a 54.8% Republican district down to a 50.5% GOP district, truly competitive, while the First drops to a 52.2% GOP district from a 55.7% district.
After 2024’s election, for some of us, taking the Trump + Robinson dynamic seemed to be not the smartest measurement of a district’s ‘true’ performance: the Stein blow-out was an anomaly that NC really hadn’t experienced in some time (at least back to 2004’s election with 12 point blow-outs at the presidential and gubernatorial level). So would it be politically wise to include the governor’s contest into a district measurement? At the time right after 2024’s election, the answer seemed straightforward: no.
But again, 2026 ain’t shaping up to be 2024. I’ll come back to this dynamic a little bit later.
What About Other State-wide Contests to Build Into a Measurement?
So, moving beyond including the governor’s contest in any district measurement, North Carolina again provides us the opportunity bring in other election results, most notably nine Council of State contests (lieutenant governor down to treasurer). What would be the district dynamics if we had the measurement equal Trump’s performance with the various Republican COS candidates’ performances as well?
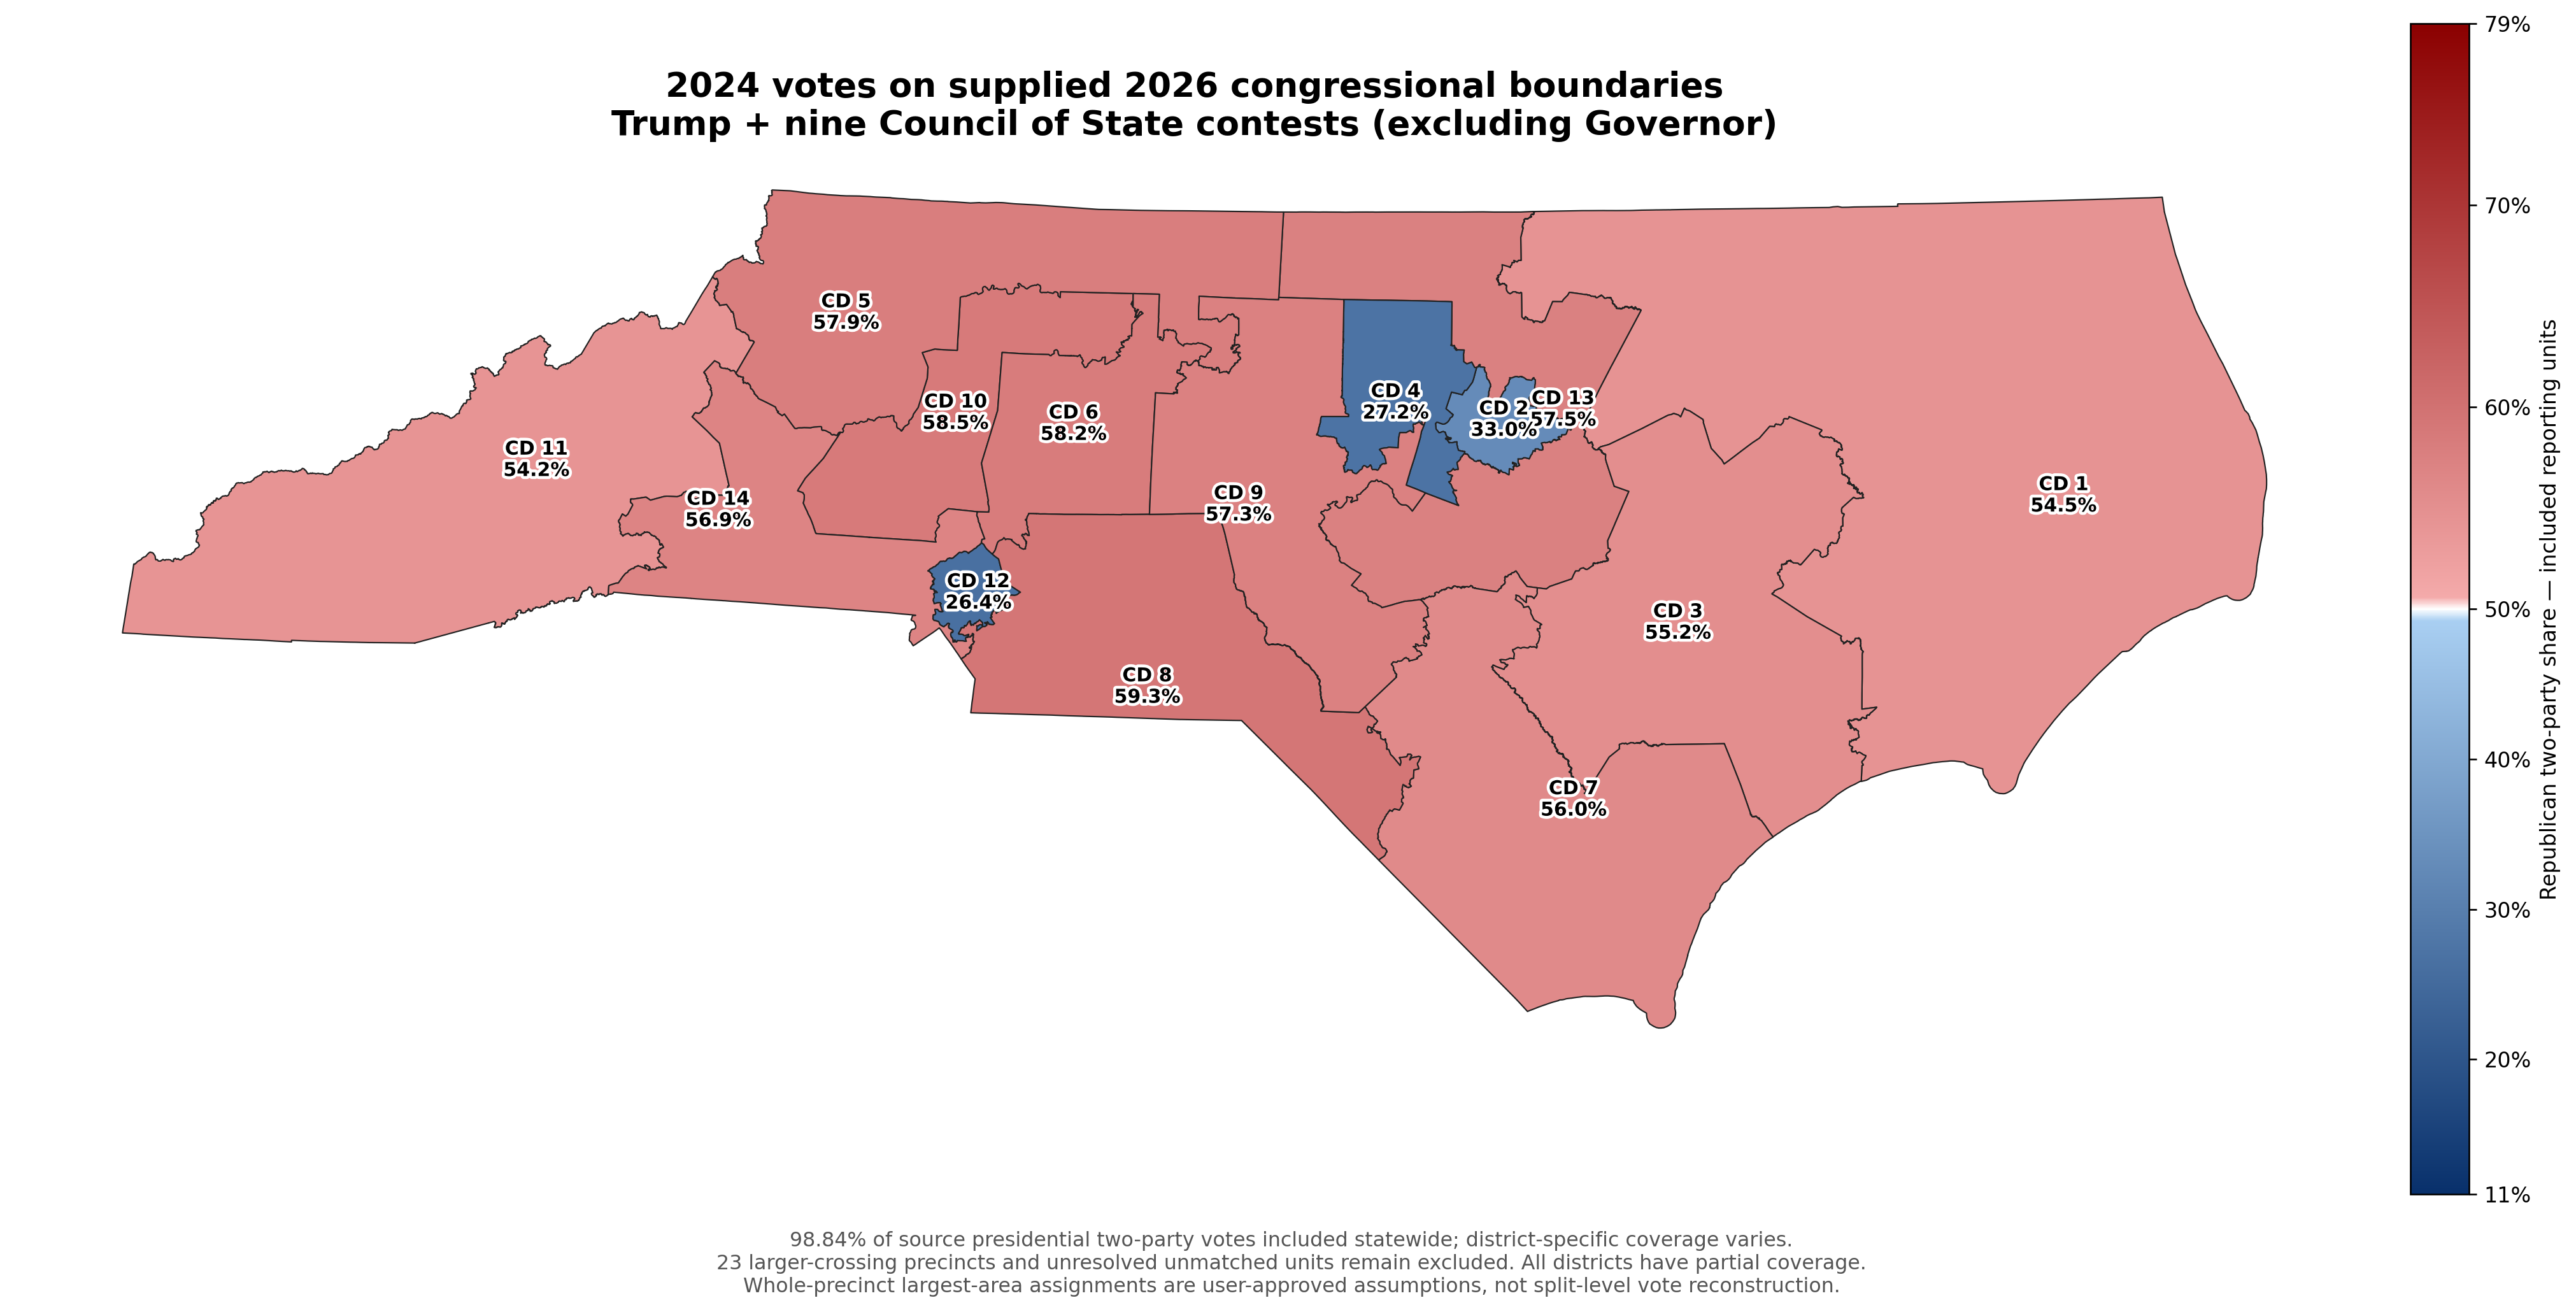
All of the districts shifted back more Republican compared to the Trump + Robinson map, but not as Republican as just the Trump vote percentage. Thus the power of North Carolina’s small, but influential, swing voters who bounce down the ballot nowadays, splitting their tickets.
Both the First and the Eleventh move into 54% territory, just on the cusp of being ‘competitive’ (cut-off level at 55%).
Finally, what happens if we have all the major state-wide contests—president, governor, and the 9 Council offices—included into a district measurement?
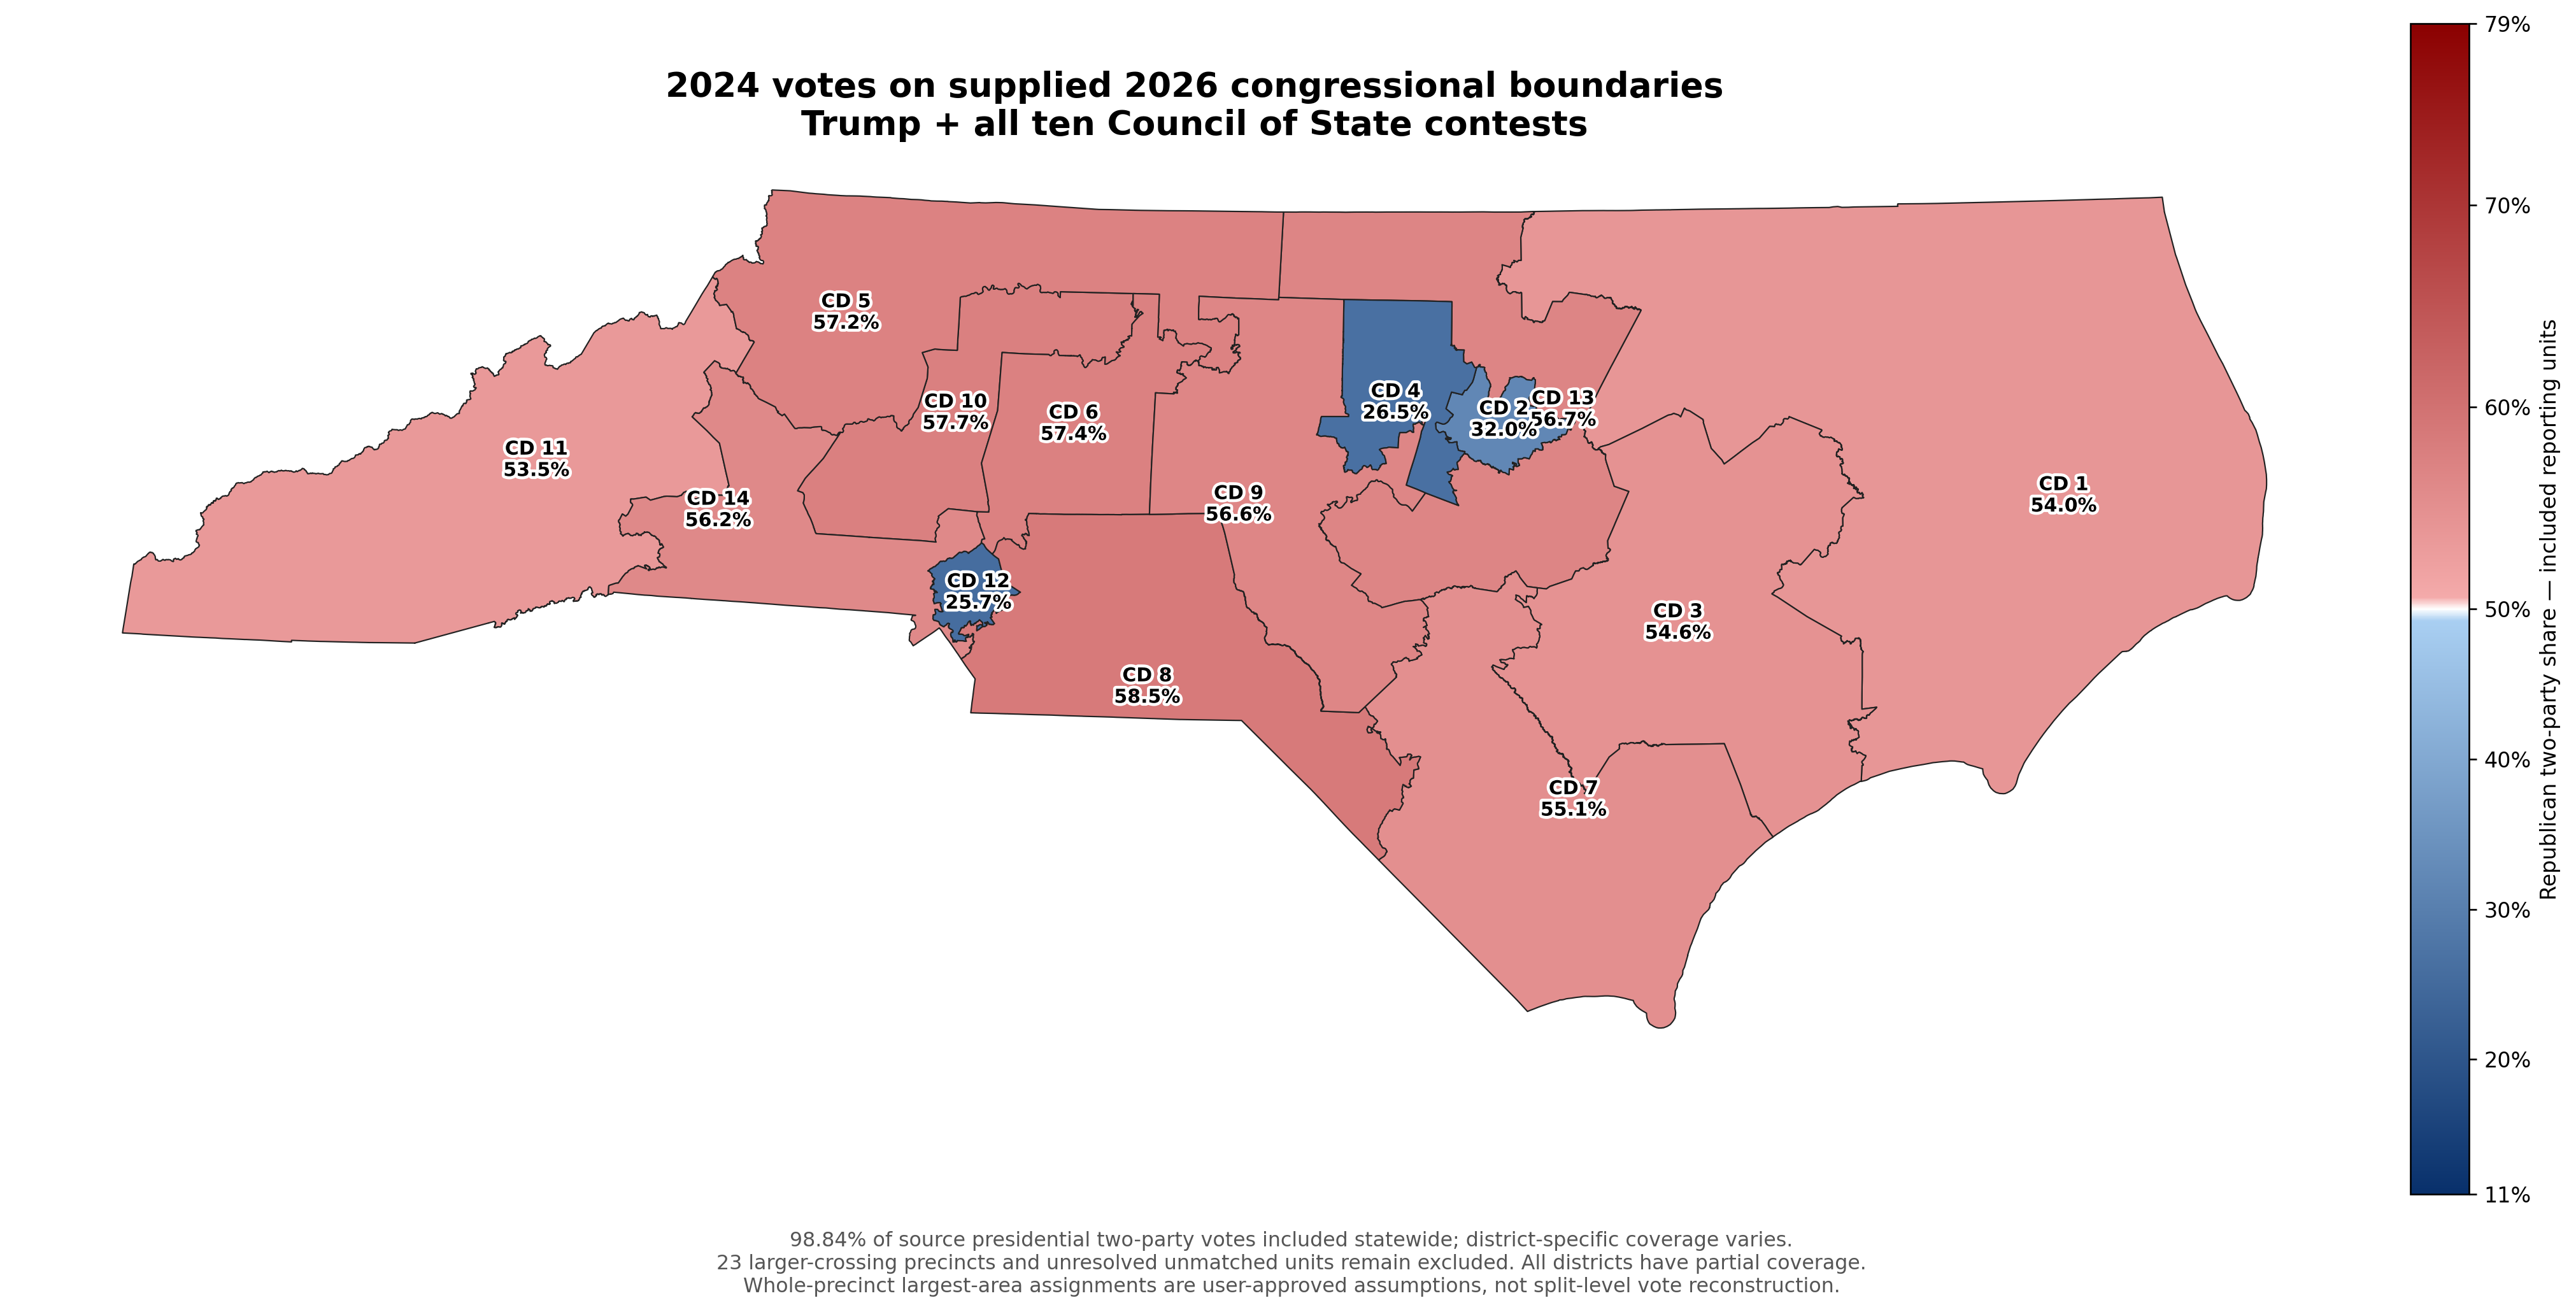
With the influence of the gubernatorial contest now included for eleven different results, we see a drop in each district’s measurement, with the First going from a Trump-only 55.7% to an all-contest 54% and the Eleventh going from a Trump-only 54.8% to 53.5% for all contests. Both again, in that competitive range below 55%.
Interesting, the Third Congressional District’s measurement drops below 55% (54.6%), while the Ninth, Thirteenth, and Fourteenth districts just hover over 55%. As a reminder: when the Republicans redistricted the First Congressional District to shift it more Republican, they took Republican precincts out of the Third and exchanged it for Democratic precincts in the First.
And if you looked at the prior congressional map used in 2024, you’ll see the swath of areas switched between the two districts, and their Trump-only vote measurement:
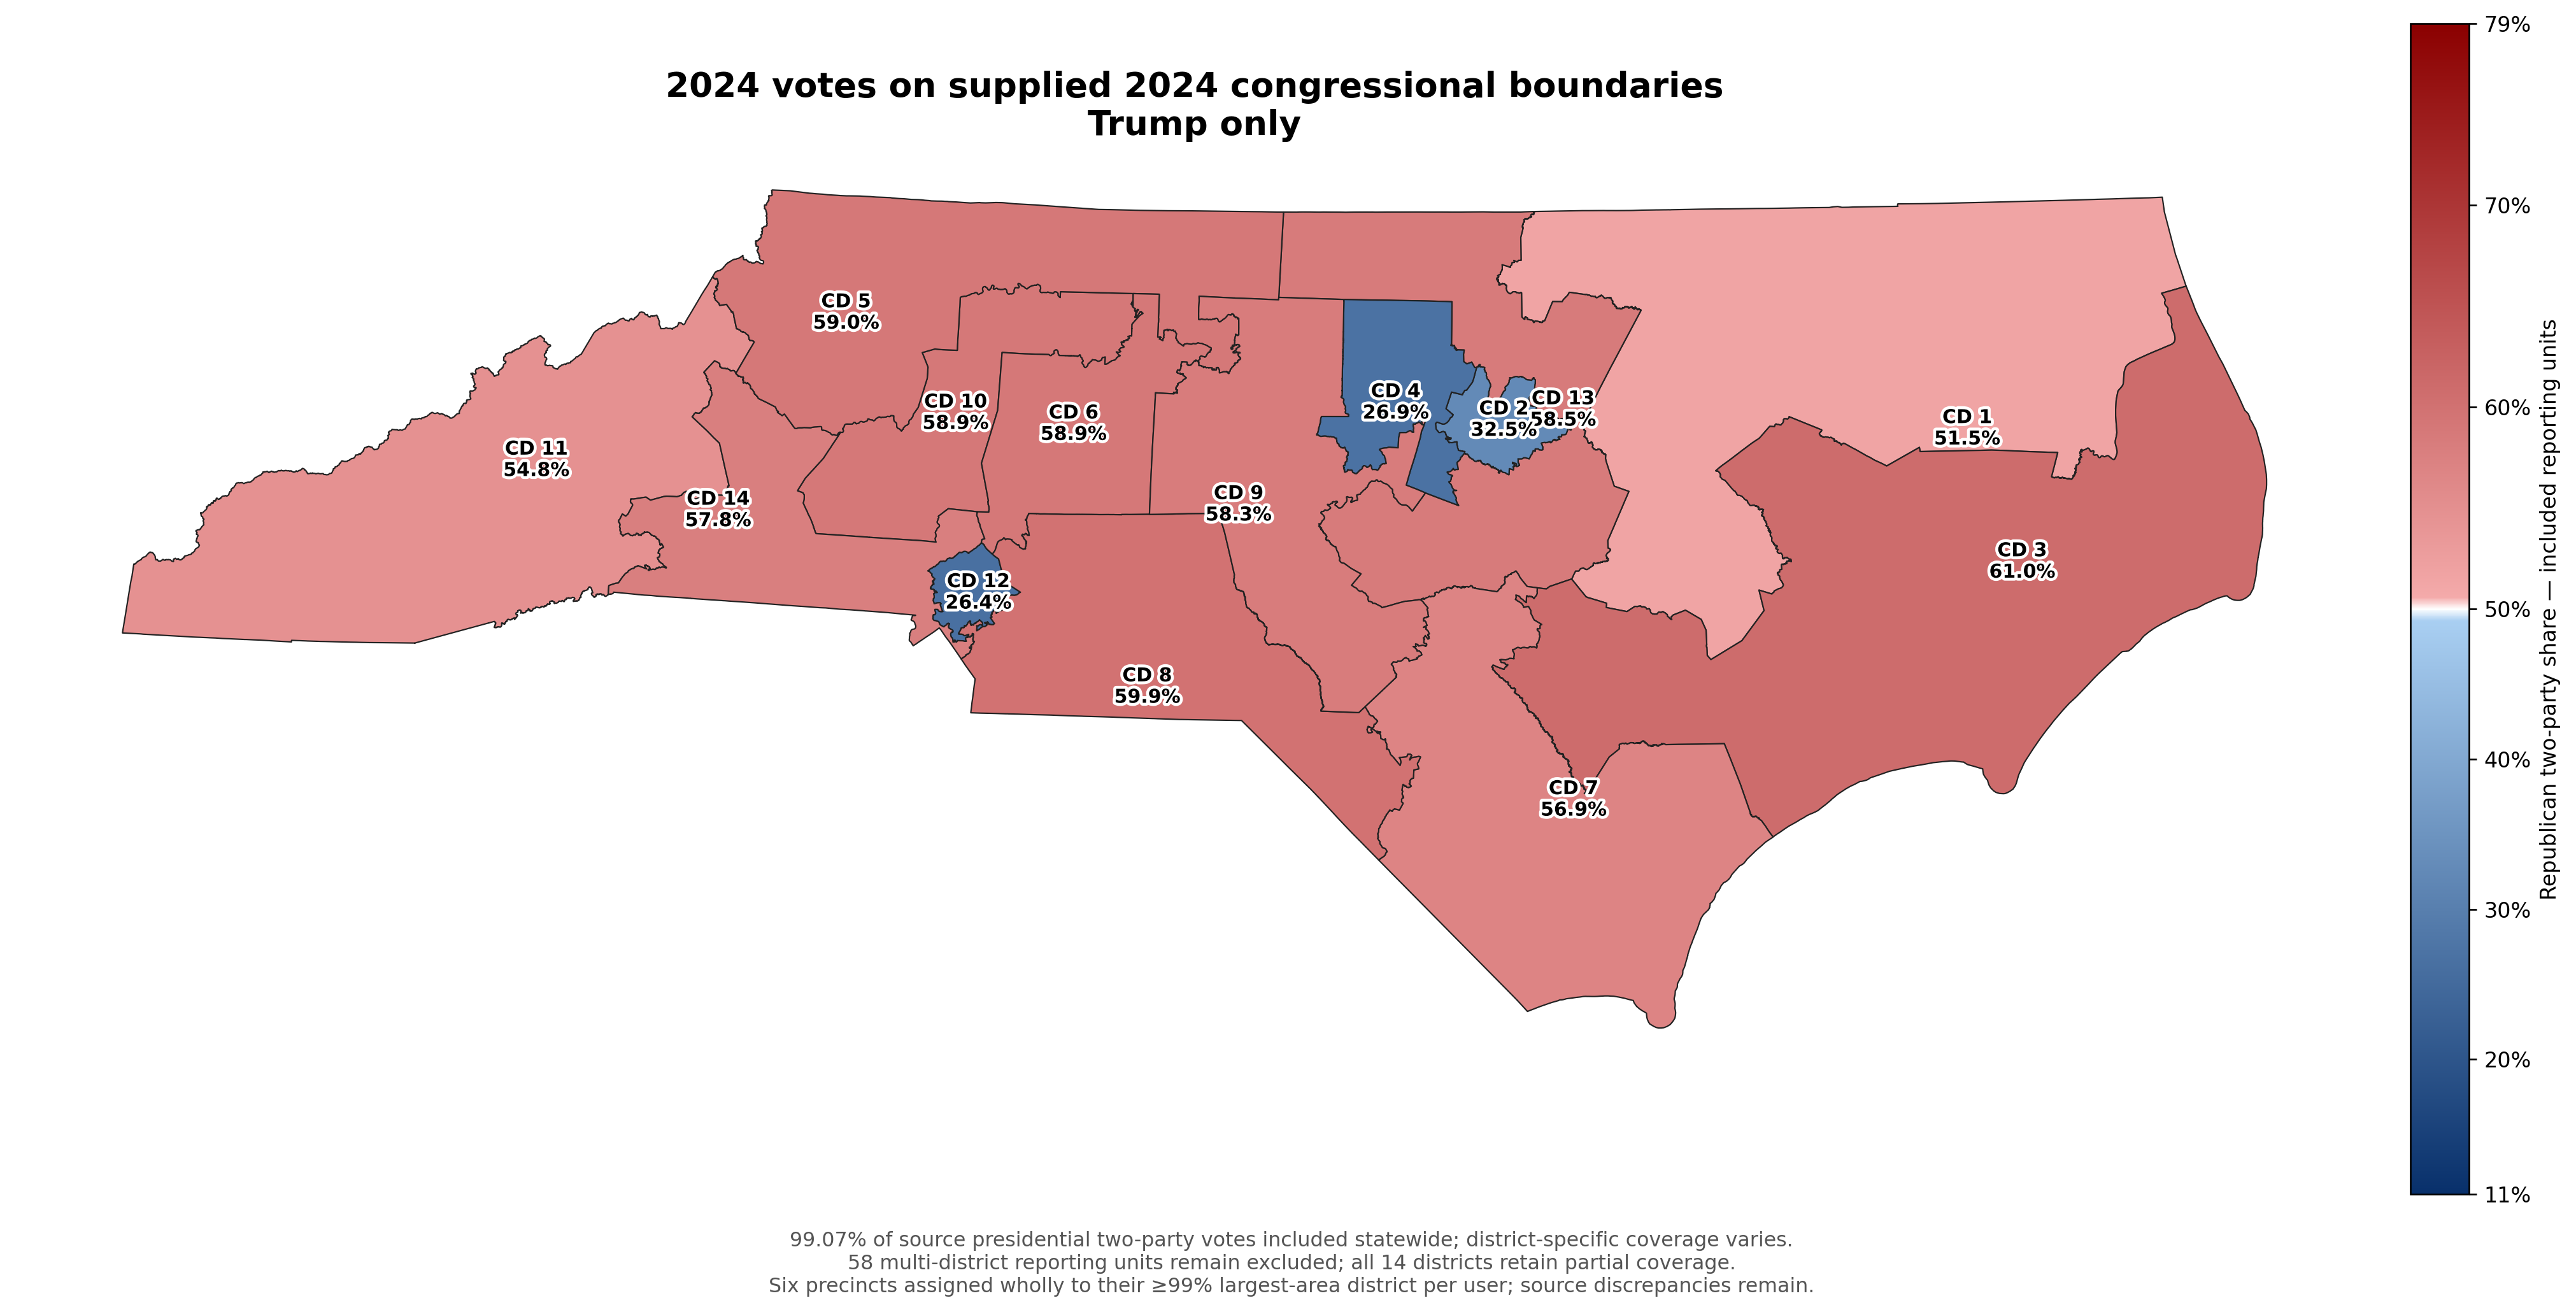
The First had a barely Trump-only Republican lean to it (51.5%), while the Third was the state’s most solid Republican district (61%). And using the all eleven-contest measurement:
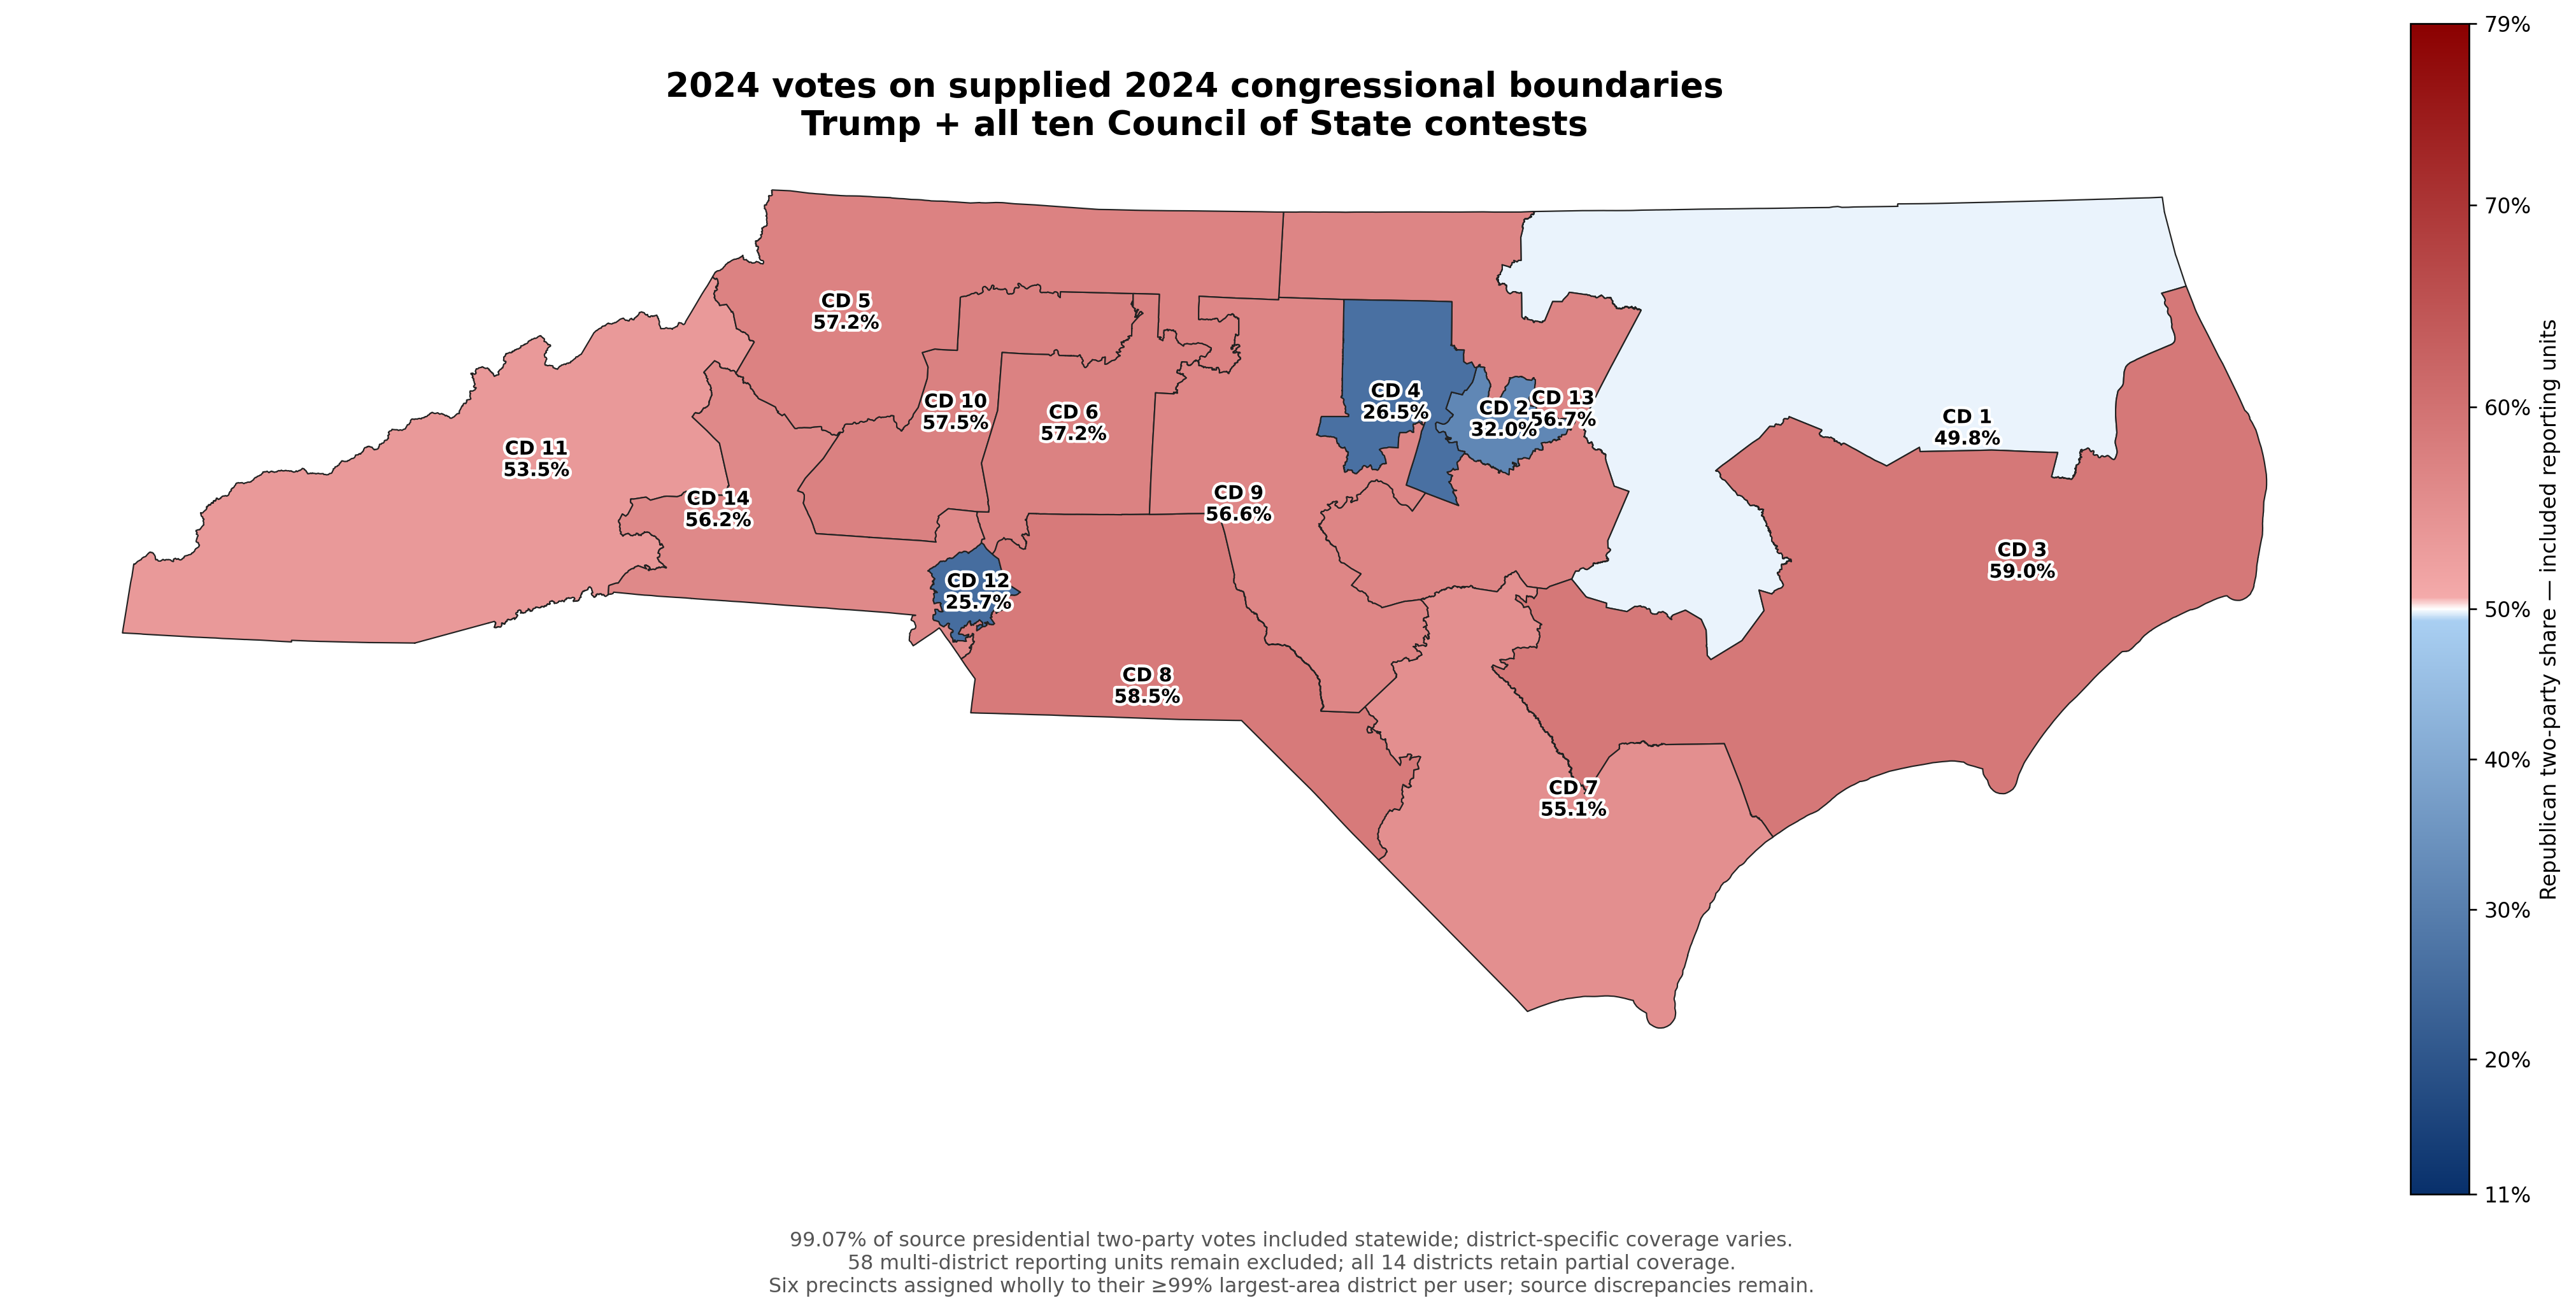
Again, the ‘old’ First District was on the knife’s edge, while the ‘old’ Third remained a pretty solid Republican district.
So Which Measurement Should We Consider for 2026?
If you’ve made it this far, then you are a true NC politics geek—and I thank you. Now the big question: which of the four2 should we consider as a baseline for the congressional districts?
I’ve been watching and thinking a great deal about this year’s political environment, not just using the Catawba-YouGov Surveys but other NC polling and the overall trends of the political mood.
And 2026 is shaping up to be a classic, if not slightly more emphasized, midterm election: the president’s approval ratings are really low (and in midterms, the president is the referendum target by the voters) and the voters are really concerned about a variety of economic dynamics (affordability, inflation, and prices in particular). Combine those two dynamics alone, and you get a potentially powerful storm against the president’s party for Congressional seats.
And we’ve been seeing that in a variety of recent movements by folks at the Cook Political Report and Larry Sabato’s Crystal Ball: pretty much every movement of recent changes in race ratings has gone to Democratic. And when states like Kansas, Nebraska, Alaska, Iowa, and Texas are considered to be the competitive dynamics of this year’s contest, that signal is really bright: Democrats will likely benefit from this year’s midterm elections (think of a blue wave), while Republicans may suffer from a red rip current pulling some of their candidates under.
For North Carolina’s congressional districts, recent news that U.S. Representative Richard Hudson is spending money on his race, in a district that is a Trump 58.3% or All Contest 56.5% Republican measurement, is a clear sign of GOP-concern.
For me, the All Contest measurement is potentially the best indicator to watch our state’s congressional contests, and with others designating the First and Eleventh as ‘competitive/toss-up’ contests, it makes the most sense. By including 2024’s gubernatorial contest into the measurements, we may get the proxy effect of a pro-Democratic shift in the electorate, while factoring in all of the normal behavior that is foundational to each district.
Discounting the 2024 governor’s election may have been the wise thing to do last year, but looking at the tea leaves this year, it may be an indicator of a potential Democratic wave building this year. And while gerrymandered district lines may be a wall to break waves against, if the wave is large enough, the overflow comes through anyway.
I’ve gone on long enough, but I’ll use these same measurements for the N.C. House of Representatives and State Senate, grouping them into categories in a future post. And my colleague and friend, Dr. Chris Cooper, will have his analysis on state legislative districts to post at his Substack, Anatomy of a Purple State, as well.
We’ll do a Lunch & Learn Zoom webinar on our analyses and the 2026 election for folks who might be interested on Wednesday, October 21 starting at noon (registration here).
In defining ‘competitive,’ most political scientists would consider a district that had the two-party candidates’ vote within a 45-55%, while ‘likely’ districts for one party would see the winning party candidate received 55-59% and ‘strong’ or ‘solid’ districts are where the winning party candidate got 60% or more.
For those interested, here is the data compiled for each congressional district by each electoral measurement:
Oh, hell yeah. If we can get rid of Foxx that would be an early Christmas present. I can dream.
Dr Bitzer: I think there will be more movement towards democrats this year and the 11th district looks like a flip, especially after the slow response to Helene relief. Don Davis has enough instincts to survive. Perhaps the 13th Congressional District where the Democratic Congressional Campaign Committee is spending some money would be a good indicator, I have worked as an election official for 15 years and I am working early voting in Durham this year. I can definitely give you some turnout reports. I think the key statewide is how well Earls and the three democratic appellate judges do.